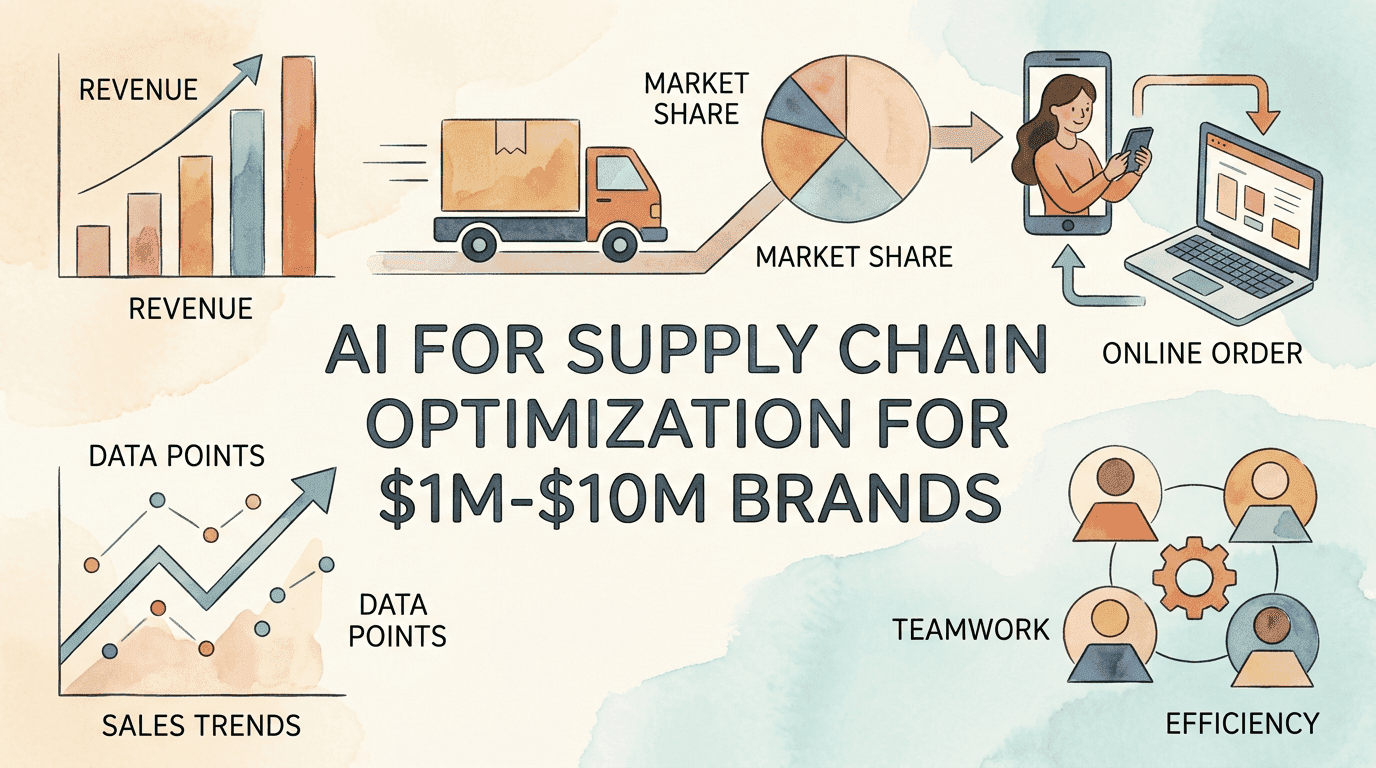
AI for Supply Chain Optimization for $1M-$10M Brands
A brand running a 60-day supplier lead time on its hero SKU and a 28-day reorder decision lag is not, in any meaningful sense, planning. It is reacting one full purchase cycle late and pretending the spreadsheet caught up.
9 min read · 8 December 2025
AI for Supply Chain Optimization for $1M-$10M Brands
A brand running a 60-day supplier lead time on its hero SKU and a 28-day reorder decision lag is not, in any meaningful sense, planning. It is reacting one full purchase cycle late and pretending the spreadsheet caught up. Most operators between $1M and $10M still close inventory the same way: a monthly S&OP meeting, a NetSuite or Cin7 export pasted into Excel, a junior team member tagging fast-movers, and a buying decision that lands two to four weeks behind the demand signal that triggered it. By the time the PO is cut, the demand wave has already broken on the warehouse floor.
This is not a forecasting problem. It is a latency problem. And AI in supply chain work is misread as a better forecast when the real prize is closing the loop between the signal and the reorder.
The 28-Day Latency Tax Bleeding Hero SKUs
Run the math on a single SKU. A 60-day lead time means that today's PO arrives on day 60. If your reorder trigger is reviewed once per month, the average decision is made 14 days after the signal fires. Add another 7 to 10 days for supplier confirmation, payment, and shipment kickoff, and you are operating with a 21 to 24 day decision-to-execution gap layered on top of the 60-day lead time. On a fast SKU growing at 15 percent month-on-month, that gap is structurally a one-cycle stockout.
McKinsey AI distribution operations reports that AI-driven supply chain planning cuts forecasting errors by 20 to 50 percent and lowers inventory levels by 20 to 30 percent. Most $1M to $10M brands never see that result, because they read the report and buy a forecast tool, not a closed-loop reorder system. The forecast gets sharper. The reorder still waits for the Tuesday-of-the-month meeting. The latency stays.
There is a quieter version of the same failure. McKinsey generative AI supply chains walks through use cases for lead-time prediction and supplier risk that depend on continuous data. The brands that buy the AI without first wiring real-time POS sell-through, 3PL stock counts, and supplier lead-time confirmations into one place are buying a Ferrari engine and bolting it to a wagon. The bottleneck was never the model. It was the data plumbing.
Sit with the cash impact. On a brand turning $5M in revenue with a 4x annual inventory turn, you are sitting on roughly $750K to $1M of inventory at any given time. A 25 percent reduction in inventory levels is $200K to $250K of working capital freed and put back to use in marketing, product development, or supplier deposits on the next category. That money is not theoretical. It is sitting frozen on your balance sheet, and the spreadsheet S&OP cycle is what keeps it there.
The Otto Group case is instructive. Otto Group stockout case documents an 80 percent stockout rate reduction after deploying ML on top of integrated demand and supply data. The headline reads as an AI win, but the structural change underneath was the closing of the signal-to-decision loop. The demand signal hit the reorder layer in hours, not weeks.
The Sense-and-Reorder Engine
I call the fix The Sense-and-Reorder Engine. It has three layers, and operators who skip any one of them get a worse outcome than the manual S&OP they replaced.
The first layer is sense. Every selling channel POS feed (Shopify, Amazon Seller Central, retail partner EDI, wholesale order book) lands in one place, refreshed at least daily and ideally hourly for hero SKUs. 3PL stock counts and warehouse pick rates layer on top. Open POs from suppliers, with confirmed ship dates and any delivery exceptions, sit alongside. The sense layer is not a dashboard. It is a single source of inventory truth that updates faster than any human can manually reconcile.
The second layer is decide. The decision logic compares projected sell-through against current on-hand stock plus open POs, applied at the SKU-channel level. The output is one of four states per SKU: healthy, accelerate (pull a PO forward), brake (delay or cancel an order), or escalate (human review required). The decision logic uses a forecast, but the forecast is just one input. The reorder point, safety stock buffer, and supplier lead-time variance carry equal weight. Cogsy reorder point walks through the operator-grade math on POLT (purchase-order lead time) that makes this layer work.
The third layer is execute. Approved reorders generate a PO draft inside the buying tool of choice, route to the named buyer for one-click approval above an order-value threshold, and trigger automatically below it. The threshold is critical. I have seen $1M to $10M operators get burned trying to fully automate reorder execution and end up overcommitting capital on a noise spike. Set the auto-approve ceiling at a SKU-PO value that, if wrong, is a recoverable mistake. Above that, a human looks at it.
I have built versions of The Sense-and-Reorder Engine inside three brands in the last 24 months and the consistent finding is that the latency collapse is what drives the working-capital release, not the sharper forecast. Cutting the signal-to-PO gap from 28 days to 48 hours is what lets you carry less buffer stock without taking on more stockout risk. The forecast gain is real. The latency gain is bigger.
Phase 1: Signal Plumbing and Supplier Reliability (Days 1-30)
Before any model gets near your reorder decisions, the data has to be clean and the suppliers have to be honest. Phase 1 is unglamorous and load-bearing.
Week 1 is data plumbing. Stand up a single inventory layer that consumes Shopify orders, Amazon settlement reports, retail EDI 850s and 856s, 3PL stock-on-hand, and open supplier POs. Cogsy, Inventory Planner, or a custom BigQuery setup all work. The picking criterion is not feature breadth. It is whether the layer can refresh the hero-SKU view at least daily and reconcile the four feeds without manual intervention. If the answer is no, fix the data before you buy any AI on top.
Week 2 is the supplier reliability audit. For every supplier touching a top-20 SKU, pull the last 12 PO ship dates against confirmed dates. Calculate lead-time variance, not just average lead time. A supplier with a 45-day average and a 10-day standard deviation is structurally different from a supplier with the same average and a 25-day standard deviation, and your safety stock has to reflect that. This is the step most operators skip. When they do, the AI reorder system amplifies a constrained supplier with faster cadence, which makes the constraint worse, not better.
Week 3 is segmentation. Sort every SKU into four buckets: hero (top 10 percent of revenue, monitored daily), supporting (next 30 percent, monitored weekly), tail (next 50 percent, monitored monthly), and discontinue candidates (bottom 10 percent, no further reorders without margin review). The Sense-and-Reorder Engine applies different review cadences and different auto-approve thresholds to each bucket. Hero SKUs get the lowest threshold and the tightest review. Tail SKUs get a higher threshold and a slower cadence. The segmentation is the gate that prevents the system from over-engineering decisions on SKUs that do not merit it.
Week 4 is the parallel-run baseline. Keep the manual S&OP cycle in place. Run the new Sense-and-Reorder Engine alongside it, generating reorder recommendations that get reviewed by the buyer but not yet acted on as the primary signal. The 30-day baseline lets you see, with real numbers, where the new system would have called a different shot than the old one, and lets the buyer build trust in the recommendations before authority shifts. Skipping this step is the most common reason AI supply chain projects get killed inside 90 days.
The KPI for Phase 1 is data freshness on the inventory layer (under 24 hours for hero SKUs), supplier lead-time variance documented for the top 20 suppliers, and at least 80 percent agreement between the manual S&OP recommendations and the parallel-run Engine recommendations.
Phase 2: Closing the Reorder Loop (Month 2-6)
Phase 2 shifts authority. The Sense-and-Reorder Engine becomes the primary reorder signal and the manual S&OP becomes the exception path. This is where the working capital release shows up in the cash conversion cycle, and where the operator's nervous system has to adjust.
Month 2 is auto-approve below threshold. For supporting and tail SKUs where PO values sit below the recoverable-mistake ceiling, the Engine generates and submits POs without human gating. The buyer reviews the daily auto-approve log and intervenes only on flagged exceptions. The output is roughly 60 to 70 percent of PO volume moving without human touch, which frees the buyer to focus on hero SKUs and supplier negotiations.
Month 3 is hero-SKU acceleration logic. Build channel-by-channel demand sensors that detect velocity changes faster than monthly aggregates. DTC demand forecasting walks through 30/60/90 day horizons across DTC, Amazon, and retail. The acceleration logic kicks in when a hero SKU's 7-day velocity exceeds its 28-day average by a configurable threshold (15 percent is a sensible starting point). The system pulls the next PO forward by 5 to 14 days, depending on supplier capacity, and notifies the buyer for approval.
Months 4 to 6 build the brake side of the loop. When velocity drops, the system delays the next PO, scales it down, or recommends cancelling open orders that have not yet shipped. This is where most operators get the biggest single working-capital win. Cancelling a $40K PO on a SKU that has gone soft is worth more than placing a smarter PO on a SKU that has gone hot, and the brake logic is what surfaces those decisions in time to act on them.
The supplier-side work runs parallel. Cogsy bottom-up planning describes the cash-aware reorder logic that ties safety stock to demand signal strength, and the supplier conversation has to follow. Move from fixed reorder cadence to flexible PO timing where the supplier accepts shorter notice for smaller adjustment orders. Most contract manufacturers will accommodate this if you commit to a quarterly volume floor and pay a small premium on the adjustment orders. The premium is paid for many times over by the working capital you stop tying up in buffer stock you no longer need.
The tooling stack at this stage is usually three layers: a data layer (BigQuery or Snowflake for warehouses doing $5M+, or a managed inventory platform under that), a decision layer (Cogsy, Inventory Planner, or a custom model), and an execution layer (your existing ERP or buying tool with API connections to the decision layer). Stockout prediction ML frames stockout prediction as a classification problem, which is the right mental model for the brake-side decision logic. You are not predicting next quarter's exact demand. You are predicting the probability that the current SKU state will tip into stockout or overstock.
The New North Star: Working Capital Velocity
Stop measuring inventory turnover in isolation. Start measuring working capital velocity, the dollars freed from inventory and put back into earning revenue per quarter. The Sense-and-Reorder Engine drives a measurable shift on this metric inside two quarters of full operation.
A $5M brand with $900K of inventory and a 10 percent reduction frees $90K. A 25 percent reduction frees $225K. That money compounds. Reinvested into customer acquisition at a 3:1 LTV/CAC ratio, $225K of freed working capital becomes $675K of incremental customer LTV inside 12 months. Cogsy inventory velocity frames the working-capital lens specifically for fast-growing physical product brands and is worth a read for the operator-side math.
The shift is not "we got better at forecasting". The shift is "we stopped letting our reorder decisions sit in a spreadsheet for three weeks while demand moved on". Most $1M to $10M brands have a reorder decision lag they have never measured and a working capital cost they have never quantified. Surface both numbers. Track them quarter over quarter. The Sense-and-Reorder Engine is the mechanism. The metric that proves it worked is the dollars you got back from your warehouse and put back to work in your business.
Unit Economics Calculator
Contribution margin per order after COGS, shipping and fees — the number scaling actually depends on.
Machine Learning For Demand Forecasting Without Stockouts
Why AI Inventory Management Tools Trap Cash In Slow SKUs
Demand Forecasting for FMCG That Beats the 60% Wall
Open to Buy Planning for Ecommerce Brands
Cash Management Strategies That Fund Self-Financed Growth
AI Driven Competitive Analysis That Catches Moves in 24 Hours
Newsletter
The Uncommon Insights Letter
Practical FMCG & eCommerce growth playbooks — margins, retention and scaling tactics, straight to your inbox.
Turn ai optimization into profit you can see
Get a hands-on operator to turn the frameworks above into results — book a free audit call.