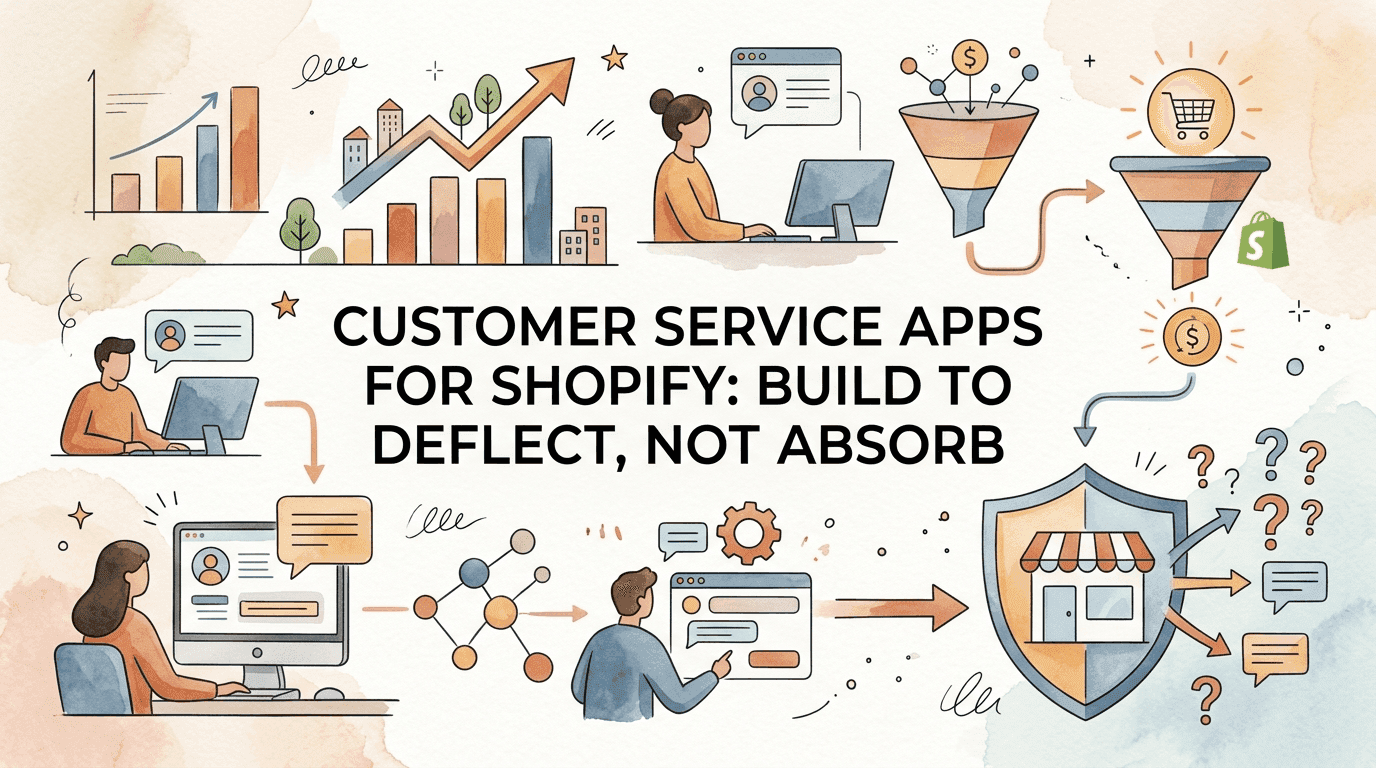
Customer Service Apps for Shopify: Build to Deflect, Not Absorb
Your support team is measuring tickets handled. Your software vendor is invoicing you per ticket. Both numbers look healthy. Both are signals that your stack is broken.
10 min read · 16 December 2025
Customer Service Apps for Shopify: Build to Deflect, Not Absorb
Your support team is measuring tickets handled. Your software vendor is invoicing you per ticket. Both numbers look healthy. Both are signals that your stack is broken.
The Helpdesk That Grows With Your Order Volume Is Failing You
In normal trading, "where is my order?" tickets account for 20 to 40 percent of an ecommerce support queue. During peak season that share climbs to 50 to 80 percent, swallowing the team in repeat questions about FedEx scans and Australia Post delays. The ecommerce email response benchmark sits at 4 to 6 hours according to response time statistics tracking first-response performance across DTC. A helpdesk that answers WISMO faster is just answering the wrong question faster.
A WISMO ticket is not a customer service event. It is a confession. The product detail page failed to set expectation. The order confirmation failed to communicate it. The tracking page failed to keep the customer calm in the gap between "shipped" and "delivered." By the time the ticket arrives, three upstream surfaces have already let the brand down. The WISMO tickets breakdown that has tracked DTC support volume for years confirms this category is structurally caused, not seasonal.
Most operators respond to this by hiring a second support agent. Gorgias's own Gorgias CS metrics overview lists 25 metrics, and the dashboards every $1M to $10M Shopify brand stares at default to tickets-per-agent, average handle time, and CSAT. None of those metrics reward the only behaviour that scales: deflection. A team paid by the ticket and praised for closure speed will never pull the cord that makes tickets vanish.
The stack-job most operators have backwards is connecting Gorgias or Zendesk into Shopify and calling it a customer service strategy. The connection is not the strategy. The strategy is deciding what tickets the helpdesk should never see in the first place.
The Support Deflection Architecture
I call this The Support Deflection Architecture. It is a three-layer model that maps every contact reason to its upstream cause, fixes the upstream surface, then routes only the residue to the helpdesk. The architecture treats the helpdesk as a measurement instrument, not a labour pool.
Layer one is the audit. You cannot deflect what you have not classified. Every contact gets a reason code, every reason code gets a frequency, and the table reads top-down: WISMO, returns and exchanges, product questions, damage and carrier issues, checkout failures, account problems. Half of the rows are not customer service problems. They are merchandising, fulfilment, or product-page problems wearing a support badge.
Layer two is upstream repair. The product detail page tells the customer when the parcel will arrive and what happens if they need to return it. The order confirmation says the same thing in plainer language. The branded tracking page absorbs the customer's anxiety in the four-day transit gap when most WISMO tickets fire. None of this is helpdesk work. All of it makes helpdesk work disappear.
Layer three is the residual stack. Once the upstream surfaces are tuned, what remains is the genuine support need: damage claims, sizing questions, custom requests, complex returns. That residue is small enough that an AI agent on first touch handles it cleanly, a macro library covers the next tier, and a human handles the remaining 10 to 20 percent. The Casely WISMO case study published by Loop showed the brand cutting 76 percent of WISMO volume after pairing Loop Tracking with Gorgias automation, equivalent to 2,000 tickets and roughly $1,880 a month off the helpdesk bill.
I have run The Support Deflection Architecture across DTC brands in apparel, homewares, and consumables between $1M and $10M. The pattern is consistent. Brands that adopt this architecture shrink their helpdesk headcount need by 30 to 50 percent within two quarters. The savings are real, but they are not the prize. The prize is what the founder gets back: a team focused on the 20 percent of contacts that actually need a human.
Phase 1: The Ticket Root-Cause Audit (Days 1-30)
Pull the last 500 closed tickets out of Gorgias, Zendesk, Re:amaze, or whichever helpdesk you are running. Export to a spreadsheet with five columns: ticket ID, reason category, free-text first message, channel (email, chat, social), and order number if present. If your helpdesk does not auto-tag reason categories, this is the audit's first finding. You cannot manage what you do not classify.
Define the reason taxonomy before you start tagging. Six categories cover roughly 95 percent of any DTC support queue: WISMO, returns or exchanges, product or sizing questions, damage or carrier complaint, checkout or payment failure, and account or login. Anything else lands in "other" for now. Do not split into 14 subcategories on day one. The audit is a frequency map, not a doctoral thesis.
Tag every row in one sitting. Two people, one afternoon, 500 tickets. The output is a single chart: contact volume by reason category. WISMO will be the largest column. Returns and damage will fight for second. Product questions will be third. Each of those has a different upstream owner.
Match every reason category to the upstream surface that created it. WISMO maps to PDP shipping copy, order confirmation, and the tracking page. Returns and exchanges map to the returns policy on the PDP and the post-purchase email flow. Product and sizing questions map to PDP description, photography, size charts, and reviews. Damage and carrier complaints map to packaging, carrier choice, and the proactive damage-claim flow. Checkout failures map to payment gateway logs and Shopify checkout settings. Account problems map to the customer login flow and password-reset email.
The output of Phase 1 is a single-page document I call the Contact-Cause Map: five rows of reason category, the percentage of total volume each one consumes, the upstream surface that owns the fix, and the team member accountable for that surface. If your operations lead, your merchandiser, and your CX manager are not all named on this document, the audit is not finished.
Set your North Star metric here. It is not tickets-per-agent. It is contacts-per-order, calculated as total contacts divided by total orders for the same trailing 30 days. Gorgias's own average response time benchmarks across DTC show the brands that pull this number below 0.15 (one contact per seven orders) are running tight stacks. Brands sitting above 0.30 are absorbing every upstream failure as a support problem. Print your number on the wall.
Phase 2: Fix the Upstream Surfaces (Month 2-6)
Start with the PDP. Pull the five highest-volume SKUs and audit each one for shipping clarity, returns clarity, and sizing confidence. Above the fold, the customer should see a delivery estimate that accounts for cut-off times and remote postcodes, a one-line returns summary, and a size-chart link if the product has variants. The Reduce WISMO tickets playbook from Squire walks through the Shopify-specific metafields and theme blocks that surface this content reliably. Most $1M to $10M brands have shipping content buried in the FAQ or a footer policy page. That is the same as not having it at all.
Order confirmation is the second fix. Shopify's default email tells the customer the order was received. It does not tell them when it will arrive, what to do if it does not, or how to track it. Rewrite the email so the first 80 words include a delivery estimate, a tracking link placeholder that activates on dispatch, and a one-line returns reminder. Test the rewrite in the Shopify email customiser, not in a third-party email tool, until the preview shows clean rendering on iOS Mail and Gmail mobile.
Build a branded tracking page next. Shopify's native order status page is functional but barebones. Loop, AfterShip, Tracktor, and ParcelPanel all sit in this slot for between $19 and $100 a month. The job is the same: surface live carrier scans, an estimated delivery window, and a one-tap "contact us" button that pre-fills the order number. The Casely case cited earlier paired a tracking page with Gorgias automation and crushed 76 percent of WISMO volume. The tracking page on its own typically removes 30 to 40 percent of WISMO contacts before any AI is added.
Layer in proactive shipping comms for the rest. When a parcel sits at a carrier hub for more than 48 hours without a scan, your tracking tool should fire a "we are checking on this for you" email before the customer asks. That single trigger cuts the WISMO call-back rate further. Klaviyo, Postscript, and Wonderment all wire into Shopify's Fulfillment API and handle this trigger natively.
Damage and carrier issues need a parallel fix. Build a one-click damage claim flow on the tracking page that captures photos, order number, and SKU and routes straight to the claims manager. This removes 80 percent of the back-and-forth from a damage ticket and makes the carrier reimbursement process auditable.
Returns is the last upstream fix in Phase 2. Plug Loop or AfterShip Returns into Shopify so the customer self-serves the return without ever opening a ticket. Loop's average DTC client routes 90 percent of returns through self-service, which means the helpdesk only sees the genuinely hard cases.
By the end of month 6, your contacts-per-order should drop by 25 to 50 percent. If it has not, the audit was incomplete. The most common failure mode is fixing the PDP but not the order confirmation, or building the tracking page but not the proactive comms. Each surface compounds the others.
Phase 3: The Residual-Volume Stack (Quarter 2 Onwards)
Now you build the helpdesk. Most brands do this first. They are wrong.
Tool choice is a decision rule, not a bake-off. For Shopify brands between $1M and $10M, the default is Gorgias. The Gorgias Shopify app has the deepest native action set: refund from the ticket pane, edit the order, push a discount code, all without leaving the conversation. Re:amaze and Richpanel are the deflection-first alternatives if you are anchoring on AI-agent volume rather than human response. Zendesk is the answer at enterprise or multi-brand scale, not at $5M.
Configure the AI agent on first touch. The 2026 Gorgias AI review by Eesel breaks down what Gorgias Automate handles natively (order status, returns initiation, simple FAQs) versus what still falls to a human (custom requests, escalations, anything outside the macro library). Map the AI agent against the residual reasons from your Contact-Cause Map. If product questions are 18 percent of remaining volume, the AI must be trained on your product catalog and review corpus. If the AI cannot answer 60 percent of those without escalating, it is not the right tool.
Build a macro library for the rest. Every recurring reason that fires more than 10 times a week gets a macro. The macro is not just a canned reply. It is a canned reply plus the Shopify action: refund this much, send this discount, push this tracking link, schedule this callback. A human still hits send, but the four-minute ticket becomes a 30-second ticket.
Set escalation rules so customers in the high-LTV tier and customers with a damage claim never hit the AI. Both segments need a human first. Both segments are also where complaint reviews and refund disputes originate. The cost of mishandling them is higher than the cost of having a human reply.
The residual helpdesk now runs on three layers. AI agent handles 40 to 60 percent of contacts. Macros handle the next 25 to 35 percent. A human handles the final 10 to 20 percent. Your headcount need is half what it was in month one, and your CSAT climbs because the human conversations are now the conversations that should be human.
The New North Star: Contacts Per Order
Stop measuring tickets-per-agent. Stop bragging about a sub-two-hour first response. Both metrics reward the wrong behaviour. They tell you how fast your helpdesk runs, not whether it should be running at all.
Print contacts-per-order on the dashboard the founder sees every morning. Track it weekly. Below 0.15 is healthy for a $1M to $10M Shopify brand running The Support Deflection Architecture cleanly. Between 0.15 and 0.30 means you have an upstream surface that is leaking. Above 0.30 means you are paying a helpdesk to clean up product, fulfilment, or merchandising failures somebody else owns.
The shift is not just cost. A team that handles the 10 to 20 percent of contacts that need a human does work that builds loyalty, surfaces product feedback, and rescues at-risk orders. A team that drowns in 1,500 WISMO contacts a month does work that breaks people. I have watched founders apologise to a CX manager who quit because the queue never shrank. The queue never shrank because nobody upstream was paid to make it.
The Support Deflection Architecture flips that arrangement. The merchandiser owns PDP shipping copy. Operations owns the order confirmation. The CX lead owns the tracking page and the AI agent. The helpdesk, finally, owns the conversations a customer would actually thank you for. That is the customer service stack that earns its budget.
Unit Economics Calculator
Contribution margin per order after COGS, shipping and fees — the number scaling actually depends on.
Natural Language Processing Applications That Move Margin
AI Customer Service Implementation Without CSAT Collapse
Why Shopify Returns Management Apps Beat Cash Refunds
The Customer Service Cliff: Why Brands Collapse Between 100 and 10,000 Orders
A Chatbot Implementation Guide That Protects Conversion Rate
Shopify Flow Automation: The Operating Engine for Scaling Stores
Newsletter
The Uncommon Insights Letter
Practical FMCG & eCommerce growth playbooks — margins, retention and scaling tactics, straight to your inbox.
Turn shopify tech stack into profit you can see
Get a hands-on operator to turn the frameworks above into results — book a free audit call.