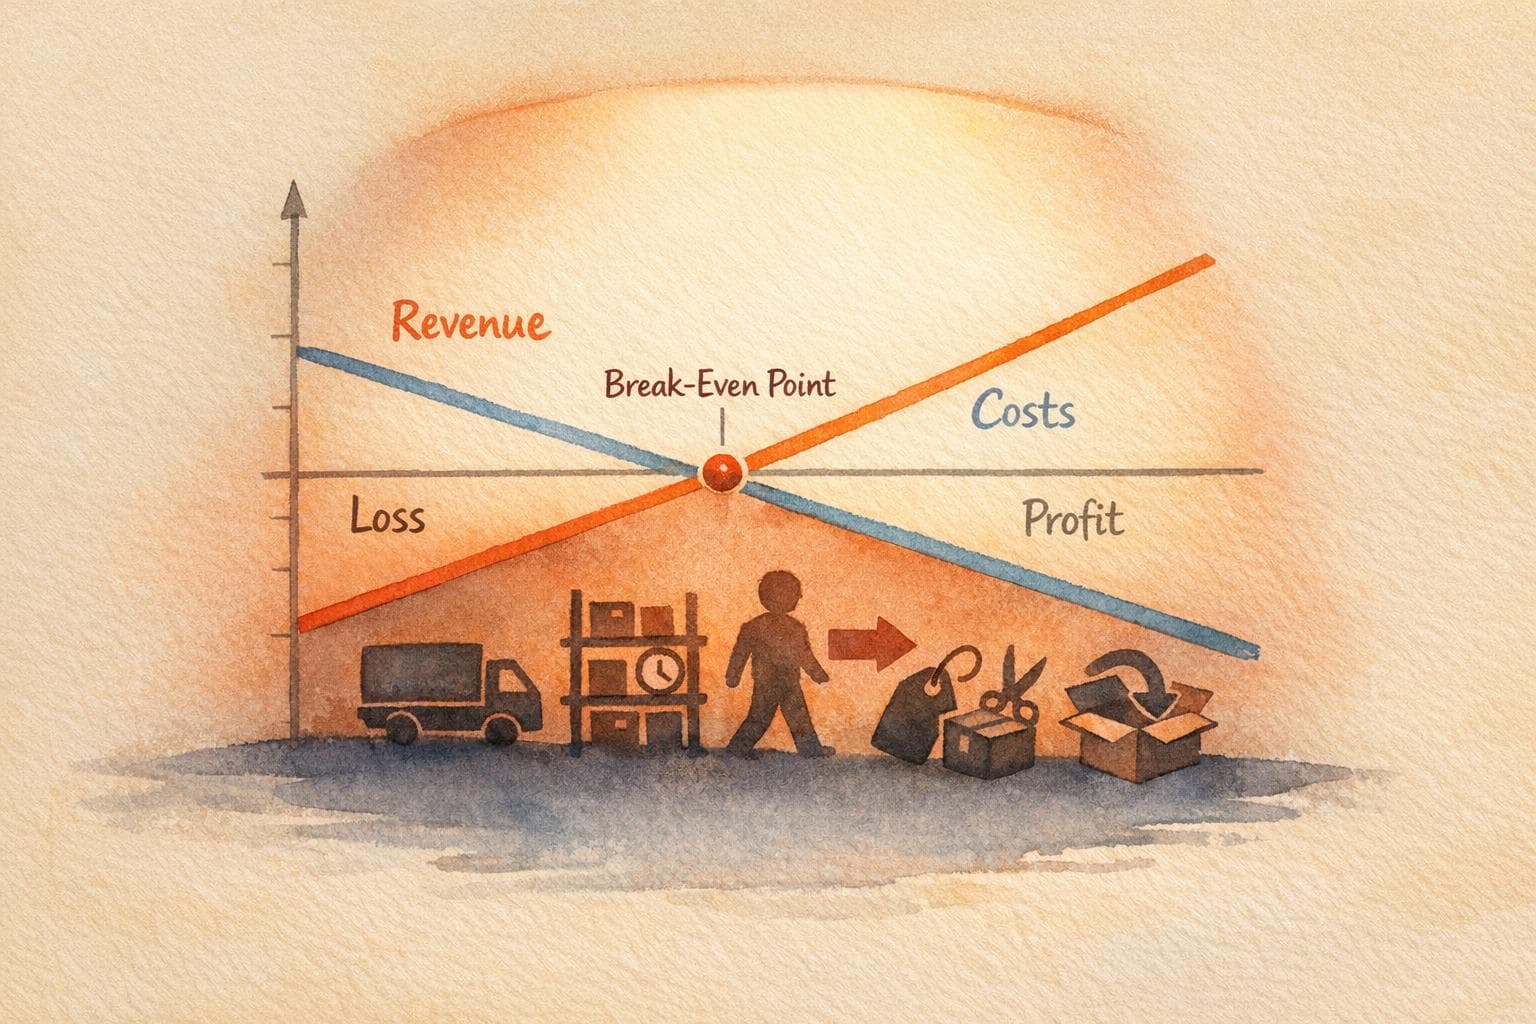
Why Your Break-Even Analysis Is Wrong: The 5 Hidden Costs Killing Your Margins
Most eCommerce brands understate break-even by ignoring five hidden costs — supply chain, inventory carrying, churn, supplier fees/shrinkflation and returns.
3 February 2026
- Break-Even ROAS Explained for Ecommerce Brands
- Hidden Cost 1: Supply Chain Inefficiencies
- Hidden Cost 2: Inventory Carrying Costs
- Hidden Cost 3: Customer Churn in Subscription Models
- Hidden Cost 4: Variable Supplier Fees and Shrinkflation
- Hidden Cost 5: Returns and Customer-Specific Services
- How to Include Hidden Costs in Your Break-Even Analysis
- Conclusion
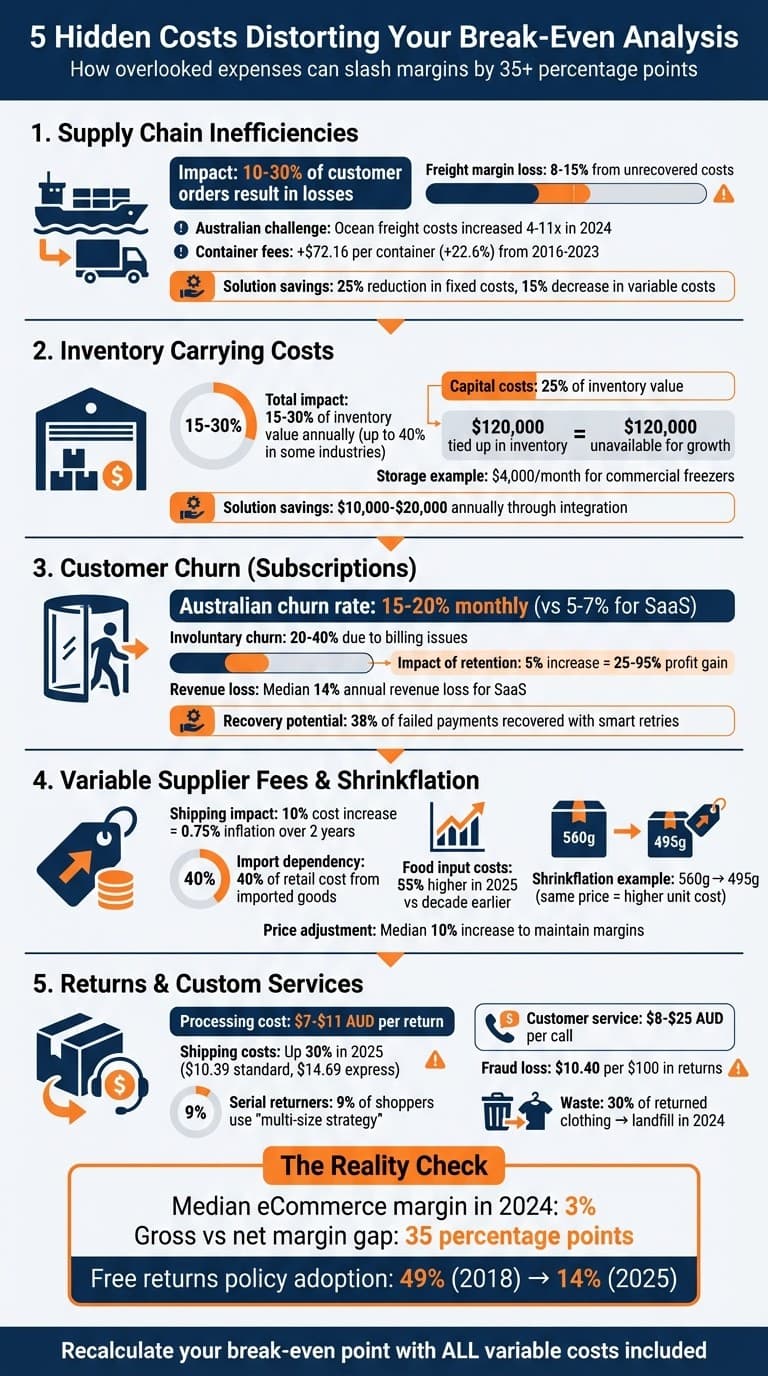
Most eCommerce businesses miscalculate their break-even point because they ignore key hidden costs. These overlooked expenses can destroy your profit margins, even when sales look strong on paper. Here's a quick rundown of the 5 hidden costs that might be distorting your financial calculations:
- Supply Chain Inefficiencies: Poor logistics and rising freight costs can erode your margins by up to 15%.
- Inventory Carrying Costs: Storage, insurance, and spoilage can add 15–30% to your inventory value annually.
- Customer Churn in Subscriptions: High cancellation rates mean lost revenue and wasted acquisition costs.
- Variable Supplier Fees & Shrinkflation: Fluctuating supplier costs and smaller product sizes reduce profitability.
- Returns & Customer-Specific Services: Reverse logistics and customisation costs can turn profitable sales into losses.
The takeaway? To get an accurate break-even point, you need to factor in all variable costs, not just gross margins. Adjust your formula to include shipping, returns, marketing, and other hidden expenses to truly understand which products are profitable and which are draining your business.
5 Hidden Costs Impacting eCommerce Break-Even Analysis
Break-Even ROAS Explained for Ecommerce Brands
Hidden Cost 1: Supply Chain Inefficiencies
Hidden costs, like supply chain inefficiencies, can significantly distort your break-even point. In Australia, these inefficiencies are particularly impactful. The country’s vast distances drive up transport expenses, often pushing supply chain costs well beyond the average 10% of overall business expenses.
The financial toll is substantial. Research shows that 10% to 30% of customer orders in many organisations result in losses due to poor tracking of logistics costs. A common oversight is failing to track landed costs at the SKU level, which can lead to an 8% to 15% loss in gross margin from unrecovered freight costs and inaccurate product cost calculations.
Brands think their product costs $8 to make when it actually costs $11 to land in their warehouse. That $3 gap is the difference between sustainable growth and a cash crisis in year three.
Let’s explore how inefficiencies arise and the financial burden they create.
Finding the Inefficiencies
Operational missteps often hide in plain sight. Manual processes - like using paper records or Excel - can result in lost orders, miscounts, and shipping errors. Poorly designed warehouse layouts and inefficient driver routes, such as unnecessary trips or vehicles sitting idle, further inflate handling, fuel, and labour costs.
The longer a van or truck spends several days each month sitting idle, it might be a bigger hidden cost than you realise... it is not adding to your profitability, yet is still costing you for insurance, registration, and potentially financing.
Australian businesses face unique challenges in this area. For example, global disruptions in 2024 forced some importers to pay 4 to 11 times more for ocean freight than the previous year. Additionally, real stevedoring revenue per lift jumped by $72.16 per container (22.6%) between 2016–17 and 2023–24, while notification fees for empty-container parks in Sydney climbed from $5.50 per container in 2018 to as much as $179.40 in early 2024.
Measuring the Financial Impact
Quantifying these inefficiencies can reveal major opportunities to cut costs. For instance, processing a paper invoice in Australia costs an average of $30.87, while an eInvoice costs just $9.18 - a reduction of around 60%. Nearly half of all purchase invoices (48%) result in "late payment" exceptions, which require extra time to resolve. On average, contested payments take 20 minutes, processing exceptions take 15 minutes, and delivery issues take 16 minutes to address.
One Australian retailer tackled these issues head-on in October 2024. By consolidating its warehouse network and using route optimisation software to create dynamic delivery paths, the company achieved a 25% reduction in fixed costs and a 15% decrease in variable transportation costs. These results highlight why addressing supply chain inefficiencies is essential. Even if traditional break-even analysis treats these costs as fixed, recalibrating your approach can unlock meaningful savings.
Hidden Cost 2: Inventory Carrying Costs
When it comes to inventory, there’s more to consider than just the upfront purchase price. Traditional break-even analysis often overlooks the hidden costs of holding inventory, which typically range between 15% and 30% of your total inventory value. In some industries, like supply chain businesses, this figure can climb as high as 40%.
For Australian eCommerce businesses - especially those dealing with perishables like fresh produce, pharmaceuticals, or cosmetics - these costs can quickly add up. Every day inventory sits in storage means extra expenses for refrigeration, insurance, and the risk of spoilage.
What Makes Up Inventory Costs
Inventory costs are made up of several components, each of which can chip away at your margins:
- Capital Costs: These are the largest portion, accounting for about 25% of your total inventory value. They include the purchase price, inventory financing solutions, and other financing fees. To put it into perspective, $120,000 tied up in inventory is $120,000 not available for expansion or other investments.
- Storage Space Costs: Think warehouse rent, utilities, and climate control expenses. For example, a QuickBooks Australia analysis in June 2024 revealed that an ice cream supplier spent $4,000 on rent and electricity just to keep their commercial freezers running.
- Service Costs: These include insurance premiums, inventory management software, and labour for stocktaking.
- Risk Costs: This category covers losses from theft, damage, obsolescence, and spoilage. One florist avoided significant losses by using a Just-In-Time inventory system, ordering flowers only one day before Valentine's Day based on demand forecasts. This strategy prevented them from being stuck with unsold, wilted stock.
Even seemingly small costs can pile up, eating into your profits more than you might expect.
How This Affects Your Margins
These extra costs can drastically shift your profit equation. Ignoring carrying costs when setting prices can lead to overestimating your margins. For instance, if you buy a product wholesale for $8 and set a retail price of $12, you might think you’re making a decent margin. But when you factor in $1.20 to $2.40 per unit in carrying costs, those margins shrink significantly.
Take the example of Wildling, a footwear merchant. By integrating their online and offline operations in February 2025, they saved $10,000 in expenses and improved stock availability by 5%. Similarly, Pepper Palace cut middleware costs by 60% after switching to Shopify POS, saving $20,000 annually.
"Inventory carrying costs account for a significant supply chain expenditure and impact the cost of goods sold, thereby directly impacting profitability." - QuickBooks Australia
For businesses handling perishable goods, the risks are even greater. Without a robust inventory management system that tracks expiration dates in real time, you could face costly write-offs. Under Australian accounting standards, businesses must write down inventory to Net Realisable Value when the expected selling price falls below cost due to obsolescence. These aren’t just theoretical losses - they’re real money slipping away.
Hidden Cost 3: Customer Churn in Subscription Models
In subscription eCommerce, customer churn disrupts break-even calculations. Every cancellation means losing immediate revenue, future earnings, and incurring higher customer acquisition costs. Let’s unpack how churn works and its financial impact.
How Churn Works
Customer churn happens when subscribers cancel or fail to renew their subscriptions. In Australia, churn rates for online retail subscriptions range between 15% and 20% per month, far higher than the 5% to 7% typically seen in SaaS businesses.
Churn can be broken down into two types:
- Voluntary churn: This occurs when customers cancel due to factors like poor service, lack of perceived value, or high costs.
- Involuntary churn: This happens due to issues like expired credit cards, bank declines, or outdated billing details. In fact, billing problems account for 20% to 40% of all churn, with 16% of customers cancelling simply because they didn’t update their payment information.
"Customer lifetime value has a direct effect on profitability and how much a subscription business can afford to spend on acquiring new customers." - Stripe
High churn directly impacts Customer Lifetime Value (LTV). When customers leave too soon, businesses often fail to recoup their acquisition costs. This forces companies to spend even more on acquiring new customers, putting additional strain on profit margins.
Calculating What Churn Costs You
To measure churn, use this formula:
(Customers at start – Customers at end + New customers acquired) / Customers at start.
This adjustment ensures that new acquisitions don’t obscure the actual losses. Another key metric is the average subscriber lifetime, calculated as 1 / Churn Rate. For instance, with a 5% monthly churn rate, the average customer stays for 20 months (1/0.05). Understanding this helps businesses determine if customers stick around long enough to justify acquisition costs.
The financial consequences of churn are striking. A 5% increase in customer retention can lead to profit gains of 25% to 95%. On the flip side, high churn forces businesses to spend more on marketing and sales just to maintain their current revenue. For example, private SaaS companies lose a median of 14% of their revenue and 13% of their customers annually. Additionally, 32% of consumers say they’d abandon a brand after just one poor experience.
To improve profitability, it’s crucial to address both voluntary and involuntary churn. Involuntary churn offers easier fixes - tools like automated billing retries or card updater services can recover lost revenue without extra marketing costs. Stripe’s Smart Retries, for instance, recover an average of 38% of failed payments. For voluntary churn, tracking customer behaviour can help identify at-risk subscribers before they cancel.
Here’s a snapshot of average monthly churn rates across industries:
| Industry | Average Monthly Churn Rate |
|---|---|
| SaaS (Software-as-a-Service) | 5%–7% |
| Fitness and Wellness | 10%–15% |
| Online Retail Subscriptions | 15%–20% |
| Media and Entertainment | 20%–30% |
Hidden Cost 4: Variable Supplier Fees and Shrinkflation
Supplier costs are rarely predictable. Fluctuations in shipping rates, raw material prices, and labour availability can cause prices to shift dramatically over short periods. For Australian businesses, this creates a double challenge: managing unexpected supplier fees and dealing with shrinkflation, both of which can distort profit calculations and erode margins.
Monitoring Supplier Price Changes
Shipping costs have a significant impact on margins. During the COVID-19 pandemic, freight costs surged, and by 2024, global container rates had nearly quadrupled due to supply chain disruptions and early Christmas stockpiling. With imported goods making up about 40% of the retail cost in Australia, even minor increases in shipping fees can have a noticeable effect.
A 10% increase in global shipping costs can push "shippable" goods inflation up by approximately 0.75 percentage points over two years. Beyond shipping, energy, fuel, insurance, and raw material costs also fluctuate unpredictably, further squeezing profit margins. Labour costs are another factor, as the competition for skilled workers in manufacturing and logistics continues to drive up wages, which suppliers pass down the chain.
"Higher global shipping costs can flow through the supply chain for imports and increase costs for Australian firms, who can in turn pass on those higher costs to consumers." - Vanessa Li, Economist, RBA
To navigate these challenges, businesses should monitor the China Containerised Freight Index (CCFI), as China remains Australia's largest source of imports. Securing long-term contracts can help reduce exposure to spot rate volatility, while diversifying suppliers can mitigate risks tied to geopolitical events or climate disruptions.
On top of rising costs, shrinkflation adds another layer of complexity to managing unit economics.
The Shrinkflation Problem
Shrinkflation occurs when suppliers reduce product sizes instead of increasing prices, effectively raising the cost per unit without changing the sticker price. This tactic creates hidden cost increases that can distort your break-even calculations.
For example, in October 2022, Coles reduced its "Mighty Grain" cereal from 560g to 495g, while Woolworths made a similar move with its "Max Charge" cereal in September 2023, downsizing from 560g to 495g. Both changes resulted in an increased unit price while maintaining the same retail price.
"Shrinkflation - where you get less for the same price - is probably the first line of defence that most retailers engage in." - Nitika Garg, Professor, UNSW Business School
The Australian government is working to strengthen the Unit Pricing Code to improve transparency. In the meantime, businesses can counter shrinkflation by focusing on unit prices (e.g., cost per gram or litre) rather than wholesale prices alone. Analysing contribution margins at the SKU level can reveal the true impact of shrinkflation on profitability. For instance, if a supplier reduces a 500-gram product to 450 grams but keeps the wholesale price unchanged, your unit economics will shift significantly.
Food manufacturing input costs in Australia were about 55% higher in 2025 compared to a decade earlier. During inflationary periods, businesses that maintained stable profit margins raised prices by a median of 10%, while those that did not saw an increase of just 6%. To stay ahead, it’s crucial to refresh profitability analyses at least quarterly to identify and address these shifts before they harm your bottom line.
Hidden Cost 5: Returns and Customer-Specific Services
When calculating profitability, returns and customised services are often overlooked but can significantly impact your bottom line. These hidden costs can transform seemingly profitable customers into financial liabilities. While high sales volumes may appear promising, the combined expenses of processing returns, offering promotional discounts, and providing custom services can quickly eat away at your margins.
Returns and Reverse Logistics Costs
Handling returns is more expensive than it seems. For instance, Intersport, under the leadership of Head of Marketing Ben Wapling in 2025, estimated that processing a single return costs between $7 and $11 AUD. This includes expenses for inspection labour, customer service, warehouse space, repackaging, and administrative tasks. Transportation alone accounts for up to 60% of reverse logistics costs. In 2025, Australian businesses faced a 30% rise in return shipping costs compared to the previous year, with standard return shipping averaging $10.39 AUD and express returns reaching $14.69 AUD. Even a single customer service call related to a return can cost between $8 and $25 AUD.
The issue of "serial returners" further compounds these costs. Approximately 9% of Australian shoppers engage in a "multi-size strategy", intentionally purchasing multiple sizes with plans to return the rest. For companies like ASOS, this behaviour has been particularly costly - 6% of its active customers caused £100 million in lost profits due to frequent returns. In response to these mounting costs, ASOS ended its free returns policy in Australia in mid-2023.
"You've got to weigh that up [the $7-$11 return cost], but you also weigh up the potential of the customer saying 'oh look, it's all a bit too hard, I'm not going to make a purchase'." - Ben Wapling, Head of Marketing, Intersport
Returns also lead to product devaluation. In industries like fashion, where trends change rapidly - sometimes within just six weeks - delays in restocking can cause significant losses in retail value. In 2024, roughly 30% of returned clothing in Australia was sent to landfills because the cost of processing these items for resale outweighed their value. Fraud adds another layer of expense, with retailers losing an average of $10.40 AUD for every $100 in returned merchandise. The percentage of Australian retailers offering free returns dropped drastically from 49% in 2018 to just 14% in 2025. By 2024/2025, brands like Afends began offering free returns only if customers accepted store credit - otherwise, customers had to pay for return shipping.
These logistical challenges are just one part of the equation. The impact of customisation and promotional efforts further complicates profitability.
Customisation and Promotional Costs
Custom services, discounts, and bundles may boost sales figures, but they often reduce the profitability of each unit sold. For example, products with margins below 50% can become unprofitable with discounts as small as 5–10%. Only products with margins above 50% can handle discounts of 10–20% without risking profitability.
High sales volumes may sometimes conceal "value destroyers" - products or customers that incur losses once returns, shipping subsidies, and marketing costs are fully accounted for. To understand the true impact of returns on your margins, use this formula:
(Return Rate × Units Sold × Cost per Return) ÷ Units Sold.
This calculation highlights the net contribution margin after factoring in all variable costs, including promotional discounts, payment processing fees (usually 2–3%), and customer-specific services. Margins vary widely across industries in Australia: beauty and skincare typically achieve 35–50%, apparel averages 25–40%, and electronics struggle with just 12–22%. When you add promotional spending and high return rates, these margins can shrink dramatically, turning what appear to be profitable customers into net losses.
Next, we’ll explore how to integrate these hidden costs into your break-even analysis for a clearer financial picture.
How to Include Hidden Costs in Your Break-Even Analysis
Once you've identified hidden costs, the next step is to adjust your break-even analysis. It's crucial to update your calculations to include all variable costs that grow with sales. These costs - like landed COGS, shipping, and returns - are essential to get a clearer picture of your profitability.
Adjusting Your Break-Even Formula
Traditional break-even analysis often focuses on gross margin alone. However, to account for hidden costs, you need to calculate contribution margin. This involves subtracting all variable costs, such as landed COGS (purchase price, inbound freight, duties, and inspections), shipping, payment processing fees, returns, and marketing attribution, from your revenue.
Here’s how the formula changes:
| Feature | Traditional Break-Even Formula | Adjusted (Hidden Cost) Formula |
|---|---|---|
| Primary Goal | Revenue = Total Costs | Contribution Margin = Fixed Costs + "Cost-to-Serve" |
| Variable Cost Input | COGS (Purchase Price) only | Landed COGS, Shipping, Returns, Payment Fees, Marketing Attribution |
| Formula (Units) | Fixed Costs ÷ (Price – COGS) | Fixed Costs ÷ (Price – Total Variable Costs per Unit) |
| Handling Returns | General expense | Allocated per SKU as (Return Rate × Cost per Return) |
| Supplier Fees | Fixed or overhead | Included in Landed COGS (Freight, Duties, Inspections) |
To calculate the returns cost per unit, multiply the return rate by the total cost of returns (including reverse logistics, inspection, and restocking), then divide by the total units sold. For businesses with multiple products, a weighted-average contribution margin offers a more accurate view. Tools like Excel's 'Goal Seek' can simplify finding your break-even point.
"The metric that should guide all product decisions is Contribution Profit Dollars - not margin percentage, not revenue, not units sold." - Uncommon Insights
Focusing on contribution profit dollars is key. For instance, a product with a 15% margin selling 10,000 units monthly can contribute more to fixed costs than a 40% margin product selling only 500 units. Keep in mind that marketing, fulfilment, and operational costs can create a 35-percentage-point gap between gross and net margins.
Financial Tools and Frameworks to Use
A four-layer profitability framework can help you audit product performance effectively. Here's how it works:
- Layer 1: Calculate gross margin (revenue minus landed COGS).
- Layer 2: Allocate variable costs like shipping, payment processing, and returns.
- Layer 3: Attribute marketing spend either directly or proportionally to revenue.
- Layer 4: Determine your true contribution margin.
This framework allows you to categorise products into groups like Stars (high volume, high margin), Cash Cows (high volume, moderate margin), Question Marks (low volume, high margin), and Dogs (low volume, low margin).
For subscription-based businesses, tracking Customer Lifetime Value (LTV) against Customer Acquisition Cost (CAC) is critical. A healthy benchmark is an LTV/CAC ratio of 3:1, meaning you earn three times what it costs to acquire a customer. Additionally, aim for a CAC payback period of less than 12 months to ensure profitability.
The Uncommon Insights' Product Profitability Template offers a structured plan for a 30-day profitability review:
- Week 1: Collect data on landed COGS and shipping.
- Week 2: Build multi-layer profitability calculations.
- Week 3: Classify products strategically.
- Week 4: Implement pricing changes or discontinue underperforming products.
"Most great companies historically have had good unit economics soon after they began monetising, even if the company as a whole lost money for a long period of time." - Sam Altman, President, Y-Combinator
This systematic approach ensures you're not just chasing revenue but identifying which products genuinely support your fixed costs.
Conclusion
The accuracy of your break-even analysis hinges on the costs you include. Overlooking hidden costs can slash margins by more than 35 percentage points. If you're only factoring in purchase price and gross margin, you're missing key expenses that can determine whether your business thrives or struggles.
For Australian eCommerce businesses, the stakes couldn't be higher. Many ventures have failed because hidden costs skewed their unit economics, often going unnoticed until it was too late. In 2024, the median margin for eCommerce brands was just 3%, leaving virtually no room for missteps. This makes understanding and addressing every hidden cost critical for survival.
"The businesses that win aren't those with the most products or the highest revenue. They're the ones who understand exactly which products make money - and have the discipline to act on that knowledge." - Uncommon Insights
This quote highlights the importance of ongoing diligence. Break-even analysis isn't a one-off exercise - it’s a continuous process. Costs like supplier rates, shipping fees, and marketing expenses are always shifting, so revisiting your analysis quarterly is essential. By doing so, you can identify margin pressures early and adapt. Instead of chasing revenue rankings, focus on contribution profit dollars and use the four-layer profitability framework to categorise your products wisely.
To grow your business effectively, consider leveraging Uncommon Insights' financial frameworks and product profitability tools tailored for Australian eCommerce brands. These resources can help you pinpoint underperforming SKUs, fine-tune your unit economics, and make informed decisions to tackle the hidden costs highlighted in this discussion. Protect your margins and set your business on a path to sustainable growth.
FAQs
How can I calculate my break-even point more accurately by including hidden costs?
To figure out your break-even point, start by identifying all the costs that affect your business - especially the ones that are easy to miss. Things like operational inefficiencies, subscription churn, and fluctuating supplier fees can sneak up on you and have a big impact on your bottom line.
Once you've got a handle on all your costs, apply this formula:
Break-Even Point (units) = Fixed Costs ÷ (Selling Price per Unit – Variable Costs per Unit)
Make sure your fixed costs include all your operational expenses, and that your variable costs represent the actual per-unit costs. Don't forget to factor in any hidden or fluctuating expenses. It's a good idea to revisit and update these numbers regularly, especially if supplier fees or other costs change. Staying on top of this will give you a clearer view of your break-even point, helping you make smarter decisions to safeguard your margins.
How can eCommerce businesses reduce supply chain inefficiencies?
Streamlining your supply chain in eCommerce is all about finding smarter ways to cut out waste and improve operations. A good starting point is leveraging technology to pinpoint bottlenecks or unnecessary steps. Tools like automation and analytics can give you a clear view of shipping, fulfilment, and returns, allowing for better decisions that boost profitability.
Another key area is supplier relationships. Strengthen these by exploring options like dual-sourcing or strategic sourcing. Negotiating fixed-price contracts can also help stabilise costs and shield your business from unpredictable price changes. On top of that, refining inventory management, improving warehouse processes, and using accurate forecasting can reduce waste and help you avoid both overstocking and stockouts.
By prioritising transparency and using data to guide decisions, eCommerce businesses can make their supply chains more efficient and cost-effective.
How does customer churn impact the profitability of subscription-based businesses?
Customer churn can hit subscription-based businesses hard, slashing recurring revenue and cutting into the customer lifetime value (LTV). When subscribers cancel or fail to pay, the immediate revenue loss is just the tip of the iceberg. Companies then have to spend more on marketing and sales to replace those lost customers, driving up costs and squeezing profit margins.
Involuntary churn - caused by issues like payment failures - is especially damaging. This often affects customers who are otherwise happy with the service but cannot renew due to technical or payment glitches. Ignoring this problem doesn’t just hurt profits; it also disrupts financial planning, making it harder to forecast accurately or determine when the business will break even.
To keep profit margins intact and ensure steady growth, addressing both voluntary and involuntary churn is non-negotiable.
Related Blog Posts
Unit Economics Mastery for DTC Brands
Checklist: Fixed vs Variable Costs for Startups
Unit Economics Checklist: Contribution Margin
Product Profitability Analysis Template
Ecommerce Cost Structure: Key Benchmarks
Unit economics template for DTC brands
Newsletter
The Uncommon Insights Letter
Practical FMCG & eCommerce growth playbooks — margins, retention and scaling tactics, straight to your inbox.
Turn these ideas into profit you can see
Get a hands-on operator to turn the frameworks above into results — book a free audit call.