5 Revenue Forecasting Methods for eCommerce
Compare five practical forecasting methods for Australian eCommerce, with pros, key metrics and guidance on seasonality, marketing spend and data needs.
13 January 2026
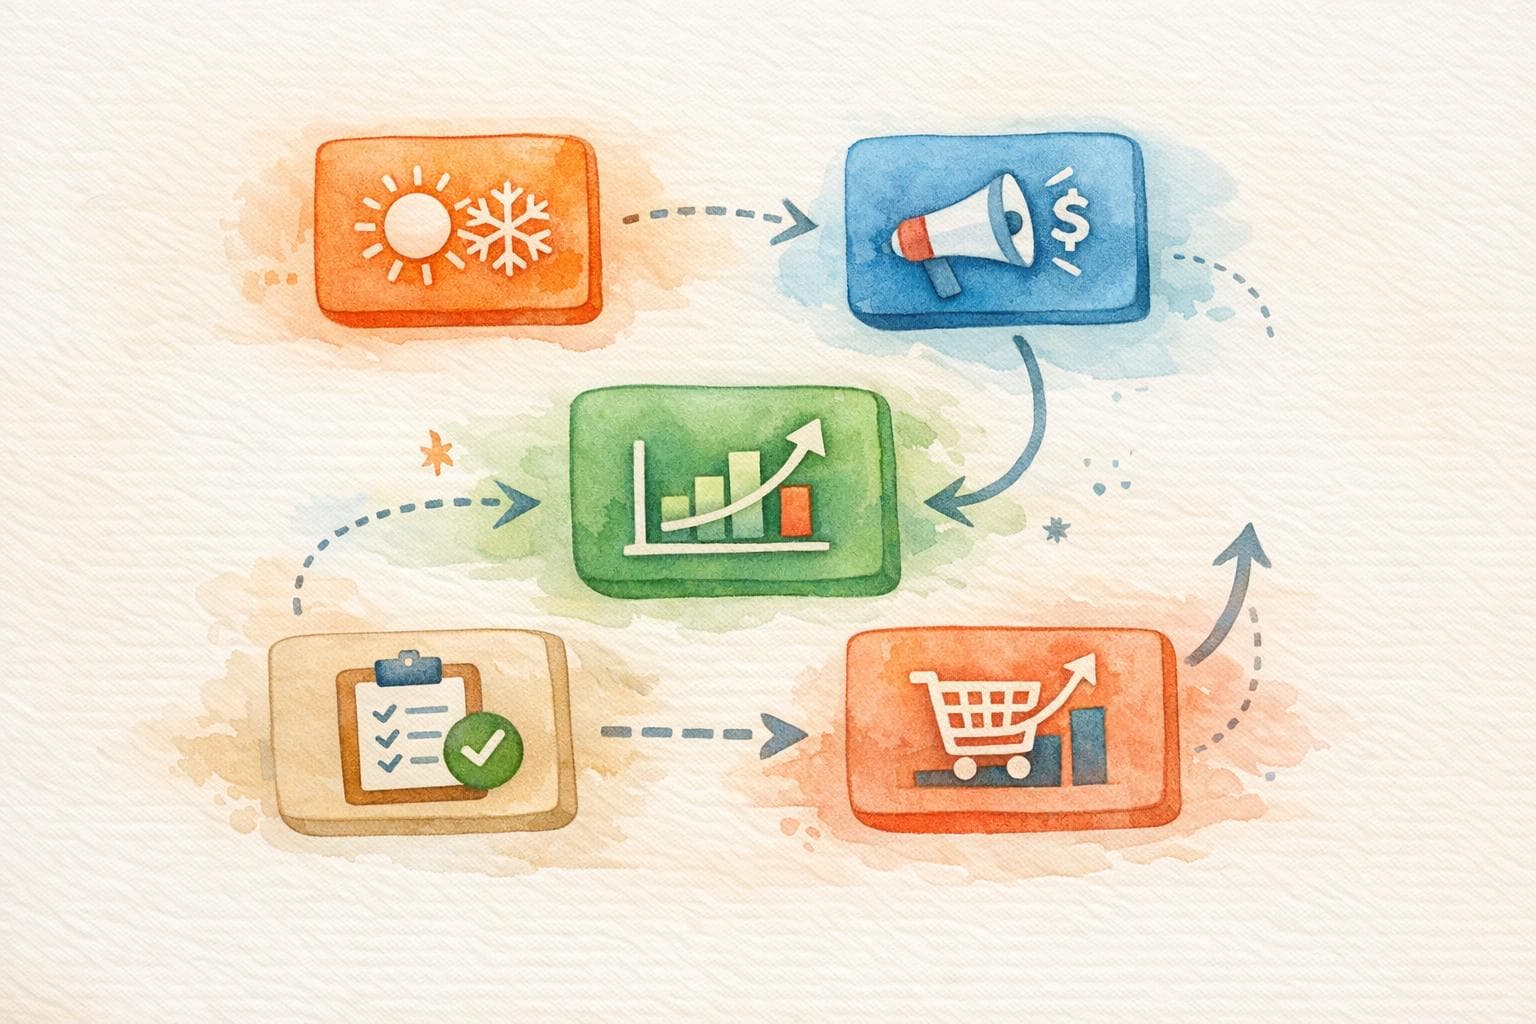
Revenue forecasting helps your eCommerce business stay ahead by predicting future sales and planning inventory, staffing, and marketing. For Australian businesses, seasonal trends like EOFY sales or Christmas spikes make accurate forecasts even more important. This guide breaks down five methods you can use, whether you're a startup or an established retailer:
- Growth Rate-Based: Simple and quick. Use past growth rates to estimate future revenue. Best for steady businesses.
- Acquisition-Based: Links revenue to marketing spend, CPA (Cost Per Acquisition), and AOV (Average Order Value). Ideal for startups or scaling efforts.
- Historical Trends Analysis: Relies on 2–3 years of sales data to identify patterns. Great for seasonal businesses.
- Market and Customer Behaviour Modelling: Uses external factors like inflation or weather alongside internal data. Best for businesses in dynamic markets.
- Unit Economics and Pipeline Forecasting: Focuses on metrics like conversion rates and sales pipelines. Perfect for B2B or high-ticket eCommerce.
Each method has its strengths and weaknesses, so combining approaches often yields the most reliable results. For example, pairing historical data with acquisition metrics can help refine forecasts during peak shopping periods like Black Friday or Boxing Day.
Quick Comparison:
| Method | Best For | Key Metrics | Challenges |
|---|---|---|---|
| Growth Rate-Based | Stable businesses | Historical Growth | Struggles with sudden market changes |
| Acquisition-Based | Startups, scaling efforts | CPA, AOV | Needs detailed data for accuracy |
| Historical Trends Analysis | Seasonal businesses | Revenue per Period | Reacts slowly to market shifts |
| Market & Customer Behaviour | Dynamic markets | CPA, External Drivers | Requires technical expertise |
| Unit Economics & Pipeline | B2B, high-ticket eCommerce | Pipeline Value, ROI | Prone to human bias in inputs |
Tailor your approach to your business stage, data quality, and market conditions to create accurate, actionable forecasts.
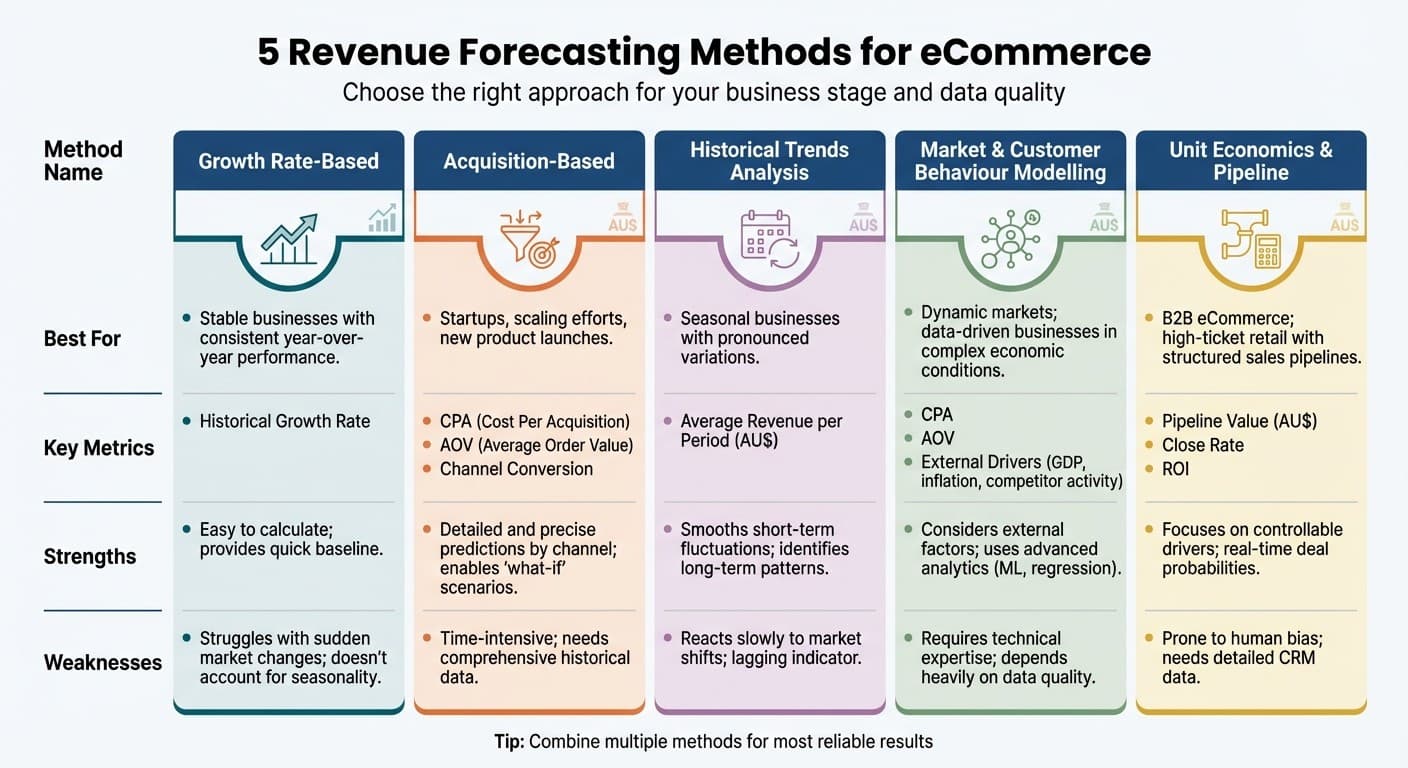
5 Revenue Forecasting Methods for eCommerce: Comparison Guide
How To Forecast Ecommerce Revenue - Use This Simple 3 Metric Framework
1. Growth Rate-Based Forecasting
Growth rate-based forecasting is one of the simplest ways to predict future revenue. To use this method, calculate the average growth rate from your historical sales data. The formula is straightforward:
(Previous period's sales − Sales of the period before that) ÷ Sales of the period before that × 100.
Then, apply it to forecast revenue using:
Forecasted Revenue = Current Revenue × (1 + Growth Rate).
For example, if your eCommerce store earned $300,000 in 2021 and $250,000 in 2020, the growth rate would be 20%. Using this rate, your projected revenue for the next year would be $360,000.
"Mathematically, growth rate-based forecasting is the simplest method to embrace." – Shopify Staff
This approach is ideal for businesses with steady revenue trends. However, it can struggle with sudden market changes, such as emerging competitors or supply chain issues. Retailers globally lost an estimated $1.77 trillion in 2023 due to inventory mismanagement, showing the importance of regularly revisiting even the most straightforward forecasts.
Ease of Implementation for $1M–$10M Businesses
For Australian eCommerce businesses generating between $1 million and $10 million annually, this method is easy to apply. You don’t need advanced tools - Excel or Google Sheets will do the job. That said, its reliability depends on having at least 2–3 years of accurate historical revenue data. If your business is relatively new, you might need to rely on industry benchmarks or market research to estimate a realistic growth rate.
Applicability to Australian Seasonality and Market Conditions
While this method provides a solid foundation, it doesn't inherently account for seasonal fluctuations. In Australia, eCommerce sales often peak during Christmas, Boxing Day, EOFY in June, and events like Afterpay Day in March and August. For instance, a business selling surfing gear might see a surge in summer, whereas candles might sell slower during the hotter months.
To refine your forecast, adjust the growth rate to reflect both internal factors (like increased marketing efforts or new product launches) and external conditions (such as inflation or competitor activity).
Dependence on Data Availability and Quality
The accuracy of growth rate-based forecasting hinges on the quality of your data. Incomplete or messy records can lead to misleading predictions, potentially causing costly inventory issues. To improve reliability, focus on cleaning your historical sales data. Remove anomalies, such as sales spikes from one-off viral campaigns, and ensure the data reflects genuine trends.
With clean data and steady market conditions, this method serves as a reliable starting point. Just be sure to incorporate seasonality, market dynamics, and changes in your strategy to keep your forecasts relevant.
2. Acquisition-Based Forecasting
Acquisition-based forecasting flips the script by starting with the costs that drive your sales and working backward. Instead of relying on a general growth rate, this approach calculates revenue using specific internal metrics: Organic Revenue + (Advertising Budget ÷ Cost Per Acquisition) × Average Order Value. By tying revenue directly to marketing spend and customer acquisition, this method provides a bottom-up view that complements growth-based forecasts. It also allows for "what-if" scenarios, such as estimating revenue if you doubled your Facebook ad budget or if your CPA increased by 15%.
For instance, imagine your organic revenue is AU$50,000 per month, you’re spending AU$10,000 on ads with a CPA of AU$25, and your AOV is AU$100. Using this formula, your projected monthly revenue would come to AU$90,000. This level of detail is especially useful when scaling marketing efforts or experimenting with new channels, as it shows the direct impact of each dollar spent.
Accuracy for eCommerce Revenue Prediction
This method provides a more precise view of revenue by basing projections on actual marketing spend and conversion data. However, its accuracy depends entirely on having clean, up-to-date data from your advertising platforms, CRM, and sales channels . If your CPA or conversion rates shift unexpectedly - due to algorithm changes or increased competition - your forecast can quickly become unreliable. For this reason, businesses often review and adjust their forecasts monthly or even weekly.
Ease of Implementation for AU$1M–AU$10M Businesses
For businesses generating between AU$1M and AU$10M annually, acquisition-based forecasting might seem complex at first but becomes much simpler with the right tools. Integrated software like Shopify, MYOB, or QuickBooks can automate data collection from advertising platforms, reducing errors and saving time . Once set up, the process is straightforward: update your ad spend and conversion metrics, and the forecast adjusts in real time. Take the example of Rider Shack, a surf shop that in 2023 used Webgility and QuickBooks to sync inventory and demand forecasts multiple times daily during peak sales events. This integration not only eliminated order cancellations but also saved the business AU$1,400 per month in lost sales.
Applicability to Australian Seasonality and Market Conditions
This forecasting method is particularly effective when tailored to Australia’s seasonal shopping trends. Events like Afterpay Day (March and August), EOFY in June, and Black Friday often see conversion rates and AOV surge by 20–30% or more. For example, during EOFY, a slight rise in conversion rates - from 5% to 5.5% - can make a noticeable difference in revenue. However, it’s also essential to account for increased CPAs during peak periods like Christmas . Breaking down forecasts by channel - whether it’s paid search, social media, email, or marketplaces - adds another layer of precision, helping you allocate your budget to the most impactful areas.
Next, we’ll dive into Historical Trends Analysis to refine your revenue projections even further.
3. Historical Trends Analysis
Historical trends analysis uses your past sales data to predict future revenue. By examining at least 2–3 years of historical revenue, you can identify patterns like seasonal peaks or consistent growth rates and extend those trends forward. Depending on your business needs, you might apply methods such as straight-line projection, moving averages, or exponential smoothing . Essentially, your sales history becomes the foundation for shaping your forecasts.
Accuracy for eCommerce Revenue Prediction
In stable business environments with predictable patterns, this approach often produces dependable forecasts. However, unexpected events - like a viral campaign - can throw off predictions . As MYOB aptly states:
"The number one rule of forecasting is: your forecast is only as accurate as your data".
To refine accuracy, try breaking your historical revenue into segments - such as product lines, geographic regions, or customer types - rather than treating all sales data as one lump sum. Additionally, take into account how local market conditions might influence these historical trends.
Applicability to Australian Seasonality and Market Conditions
When applying historical analysis to Australian eCommerce, it’s crucial to factor in local seasonal patterns that differ from those in the Northern Hemisphere. For instance, your data should reflect key drivers like the November–December holiday rush, EOFY sales in June, and weather-related demand (e.g., summer spikes for outdoor furniture or sunscreen) . With Australia’s slowing population growth, you might also need to temper historical growth rates for a more cautious long-term outlook. Scenario planning - considering best, worst, and most likely outcomes - can help prepare your business for potential disruptions.
Ease of Implementation for AU$1M–AU$10M Businesses
Businesses in the AU$1M–AU$10M range can streamline this process using tools like QuickBooks or MYOB, which consolidate multi-channel sales data and ensure accuracy . Once your data is in order, applying methods like moving averages or straight-line projections becomes straightforward. The real challenge lies in keeping your data clean - removing duplicates, fixing errors, and accounting for anomalies - so your forecasts reflect genuine trends rather than noise .
Dependence on Data Availability and Quality
The success of historical trends analysis hinges on having complete, accurate records. Ideally, you’ll need at least 2–3 years of monthly or quarterly revenue data, along with context on internal factors like marketing spend, pricing shifts, or product launches . Missing or outdated data can distort projections and put cash flow at risk . To minimise these risks, automate data collection wherever possible and complement your quantitative analysis with qualitative insights from your sales team. They can highlight market changes that raw numbers might not fully reveal .
4. Market and Customer Behaviour Modelling
Market and customer behaviour modelling takes forecasting to the next level by incorporating external factors alongside historical data. These factors include economic indicators like GDP and inflation, competitor moves, consumer trends, and even weather patterns. For Australian eCommerce businesses, this means considering influences like slower population growth - highlighted by The Australian Financial Review as a potential drag on long-term retail sales - and weather-driven demand surges, such as increased ice cream sales during a hot summer. By accounting for these external drivers, businesses can better anticipate shifts that traditional data might overlook.
Accuracy for eCommerce Revenue Prediction
Causal models, such as regression analysis, significantly enhance forecasting accuracy by uncovering statistical links between revenue and specific factors like marketing spend, website traffic, or loyalty program enrolments. Machine learning techniques, including neural networks and random forests, go a step further by identifying complex, non-linear patterns that simpler models might miss. Pairing these quantitative models with team insights and scenario planning allows businesses to better predict potential revenue changes.
Applicability to Australian Seasonality and Market Conditions
This approach aligns perfectly with Australia’s unique market dynamics. Think of the end-of-financial-year sales in June, summer spikes in demand for outdoor gear, or the changing shopping habits shaped by the post-pandemic world. Leading indicators, such as new loyalty program sign-ups, can help forecast future revenue, while lagging indicators, like return rates, validate past trends. Active forecasting also factors in upcoming marketing campaigns, product launches, and broader economic changes - elements that historical data alone can't fully capture. This method complements internal forecasting techniques by weaving in real-time market signals.
Ease of Implementation for AU$1M–AU$10M Businesses
For businesses with annual revenues between AU$1M and AU$10M, modern tools like MYOB, QuickBooks, and Shopify simplify the process by automating data collection and offering built-in modelling features. A bottom-up forecasting approach - starting with individual product lines or sales channels rather than overarching growth assumptions - provides greater precision. Regularly updating forecasts, whether monthly or quarterly, is essential to account for sudden shifts in competition or the economy. For new products or locations lacking historical data, methods like the Delphi technique (expert panels) or customer surveys can offer valuable demand insights.
Dependence on Data Availability and Quality
The effectiveness of market and customer behaviour modelling hinges on having clean, well-integrated data from all sales channels. When applying advanced methods like regression analysis, it’s also crucial to address technical issues such as stationarity and multicollinearity. Without high-quality data, even the most sophisticated models can fall short.
5. Unit Economics and Pipeline Forecasting
Unit economics and pipeline forecasting zero in on the key drivers of your business, building revenue estimates from the ground up using internal performance data. For eCommerce businesses, this means starting with your marketing budget and conversion rates to estimate total revenue. Pipeline forecasting adds another layer by tracking active opportunities - like pending B2B wholesale orders or high-intent abandoned carts - and calculating their potential value based on expected close rates.
Accuracy for eCommerce Revenue Prediction
This method produces accurate revenue forecasts by focusing on metrics you can control. Breaking down revenue by channels - such as social media, email, or marketplaces - helps you identify where to improve ROI and spot underperforming areas quickly. Pipeline forecasting sharpens these projections by assigning probabilities to each stage of the sales process, whether it’s a wholesale lead in negotiation or a cart abandonment with strong recovery chances. This detailed approach also allows businesses to respond effectively to shifts in local market conditions.
Applicability to Australian Seasonality and Market Conditions
For Australian eCommerce businesses, adjusting forecasts for seasonal patterns is crucial. Conversion rates often surge during high-activity periods like Black Friday or Boxing Day, while quieter months like February may require more conservative estimates. External factors, such as changes in interest rates or competitor activity, should also be factored in. Scenario planning - creating best-case, worst-case, and most-likely projections - can help businesses prepare for a range of outcomes and manage risks effectively.
Ease of Implementation for AU$1M–AU$10M Businesses
For businesses within this revenue range, this approach complements other forecasting methods by offering detailed, channel-specific insights. Tools like QuickBooks and MYOB can automate data collection, pulling information from sales pipelines and historical records. A bottom-up strategy - starting with granular channel data rather than broad market trends - can deliver more precise forecasts for targeted campaigns. However, the success of this approach hinges on the quality of your data. Issues like manual entry errors, duplicate records, or missing information in your CRM can compromise even the most advanced models.
Dependence on Data Availability and Quality
High-quality, integrated data is non-negotiable. For B2B or high-touch eCommerce businesses, you’ll need detailed pipeline data, including deal values, win rates, and conversion likelihoods at every stage. For B2C operations, key metrics like CPA (Cost Per Acquisition), AOV (Average Order Value), and advertising budgets are essential. Data errors or silos in your CRM, accounting software, or eCommerce platform can distort your forecasts. To navigate volatile markets, rolling forecasts - updated regularly as conditions change - are far more effective than static, annual projections.
Method Comparison Table
Choosing the right forecasting method depends on factors like business maturity, the quality of your data, and how much seasonal variation impacts your operations. Each method offers advantages and drawbacks, which can make a big difference whether you're running a steady brand or pushing for rapid growth through paid marketing channels.
The table below outlines five forecasting methods, highlighting their strengths, weaknesses, best use cases, and key metrics. This is especially relevant for Australian eCommerce businesses during peak shopping seasons like Black Friday, Cyber Monday, and the Christmas/Boxing Day period.
| Method | Strengths | Weaknesses | Best Use Case | Key Metrics |
|---|---|---|---|---|
| Growth Rate‑Based | Easy to calculate; provides a quick baseline for stable businesses | Poor accuracy in volatile markets; doesn’t account for seasonality or market changes | Ideal for mature eCommerce brands with consistent year‑over‑year performance | Historical Growth Rate |
| Acquisition‑Based | Offers detailed and precise predictions by analysing individual channels and products | Time‑intensive; needs comprehensive historical data for every segment | Suited for startups, new product launches, or businesses with aggressive growth plans | CPA, AOV, Channel Conversion |
| Historical Trends Analysis | Smooths out short-term fluctuations; great for identifying long-term patterns | Reacts slowly to sudden market changes; serves as a lagging indicator | Works well for businesses with pronounced seasonal variations | Average Revenue per Period |
| Market and Customer Behaviour Modelling | Considers external factors like inflation, competitor actions, and marketing spend | Requires technical expertise; results depend heavily on data quality | Best for data-driven businesses in dynamic or complex economic conditions | CPA, AOV, External Drivers |
| Unit Economics and Pipeline Forecasting | Focuses on real-time deal probabilities and key drivers like conversion and retention | Can be skewed by human bias or overly optimistic sales and marketing inputs | Tailored for B2B eCommerce or high-ticket retail with structured sales pipelines | Pipeline Value, Close Rate |
This comparison highlights the trade-offs of each method. Many Australian businesses find value in combining approaches - for instance, using Historical Trends Analysis for stable, predictable patterns while incorporating Acquisition‑Based Forecasting to adapt to real-time changes in metrics like CPA and AOV across channels. Additionally, leveraging accounting software for forecasting can save small business owners up to 9 hours a week, making it easier to implement hybrid strategies.
To mitigate risks like supply chain issues or sudden drops in consumer confidence, it's always a good idea to plan for multiple scenarios: best-case, worst-case, and most-likely outcomes.
Conclusion
The strength of your revenue forecast lies in the strategy that drives it. Selecting the right forecasting method is crucial for making informed decisions across various aspects of your business - whether it’s managing inventory, planning staffing levels, or preparing for major sales events like the Boxing Day rush. Accurate forecasts empower you to act with confidence, whether you're ramping up advertising or expanding your team.
"Revenue forecasting is important because it informs financial planning and decision making. This can lead to better financial health and performance." - MYOB
There’s no one-size-fits-all approach to revenue forecasting for Australian eCommerce businesses. The best method for you will depend on factors like your stage of growth, the quality of your data, and the stability of your market. Tailoring your approach to these variables ensures your forecasts remain as effective and actionable as possible.
FAQs
What’s the best way to forecast revenue for my eCommerce business?
The ideal revenue forecasting method for your eCommerce business hinges on your objectives, the data you have on hand, and the intricacies of your operations. Forecasting revenue is essential - it allows you to predict future sales, allocate budgets wisely, manage cash flow effectively, and make smarter decisions around marketing and hiring.
For businesses with at least 12 months of consistent sales data, a historical trend model - such as moving averages or year-over-year growth - can work well, especially for stable product lines. On the other hand, if you're dealing with new product categories or navigating unpredictable markets, a market analysis approach that factors in industry trends and economic conditions might provide more relevant insights. If you’re tracking customer behaviour, like repeat purchases or average basket size, behavioural modelling can help you understand the effects of promotions, seasonality, and shopping habits. For those with access to diverse data sources, hybrid models - which blend multiple methods - can deliver more nuanced and detailed forecasts.
When deciding on an approach, think about the quality of your data, the time frame you’re forecasting (weekly, monthly, or annually), and the resources at your disposal. Testing different methods on historical data can help you identify what works best. If you need guidance, Uncommon Insights can help develop a forecasting model tailored to your business and the Australian market, ensuring your strategy remains effective throughout the year.
Why is high-quality data crucial for accurate revenue forecasting in eCommerce?
Accurate revenue forecasting hinges on the quality of your data. These forecasts draw from historical sales figures, market trends, and customer behaviour. But if your data is riddled with issues - like duplicates, missing entries, or outdated details - it can skew your projections, leading to outcomes that are either overly optimistic or unnecessarily cautious.
For Australian eCommerce businesses, maintaining clean data is particularly crucial. This means standardising transaction records in AUD ($), using the dd/mm/yyyy date format, and applying metric units where relevant. By adopting strong data-governance practices and implementing automated validation rules, you can ensure that your forecasting models are built on reliable, accurate information.
The payoff? Dependable projections that support smarter decisions about inventory management, marketing budgets, and growth strategies - all tailored to the unique needs of the Australian market.
How do seasonal trends in Australia impact eCommerce revenue forecasting?
Seasonal trends heavily influence eCommerce revenue in Australia, with consumer behaviour shifting in response to key events and the changing weather. During summer (December to February), spending typically rises on holiday gifts, beachwear, and outdoor essentials. This period also includes major sales events like Boxing Day and Black Friday, which drive additional revenue surges. Conversely, winter (June to August) sees heightened demand for heating appliances and indoor entertainment. Other important times include Mother’s Day in May and the back-to-school shopping period in January and February.
To create reliable forecasts, businesses need to blend historical sales data with Australia’s distinct calendar of holidays and seasonal weather patterns. This approach helps account for demand fluctuations and avoids the pitfalls of relying solely on year-on-year growth metrics. Aligning these forecasts with the Australian financial year (July to June) and factoring in seasonal adjustments allows businesses to optimise inventory, staffing, and marketing budgets, ultimately improving cash flow and profitability.
Related Blog Posts
Solving Seasonal Inventory Challenges with AI
How Seasonal Demand Impacts Working Capital
AI Inventory Optimisation for FMCG: A Guide
How To Build a Social Media ROI Dashboard
Top Churn Prediction Techniques: A Comprehensive Guide
Predictive Segmentation for FMCG Growth
Newsletter
The Uncommon Insights Letter
Practical FMCG & eCommerce growth playbooks — margins, retention and scaling tactics, straight to your inbox.
Turn these ideas into profit you can see
Get a hands-on operator to turn the frameworks above into results — book a free audit call.