Your NPS Score Is a Vanity Metric (Here's What to Measure Instead)
NPS has become the metric everyone measures and nobody acts on. Learn why "likelihood to recommend" doesn't predict actual retention, the alternative metrics that actually correlate with revenue, and the "Behavioral Health Score" framework that replaces survey sentiment with observable action.
11 min read · 6 June 2025
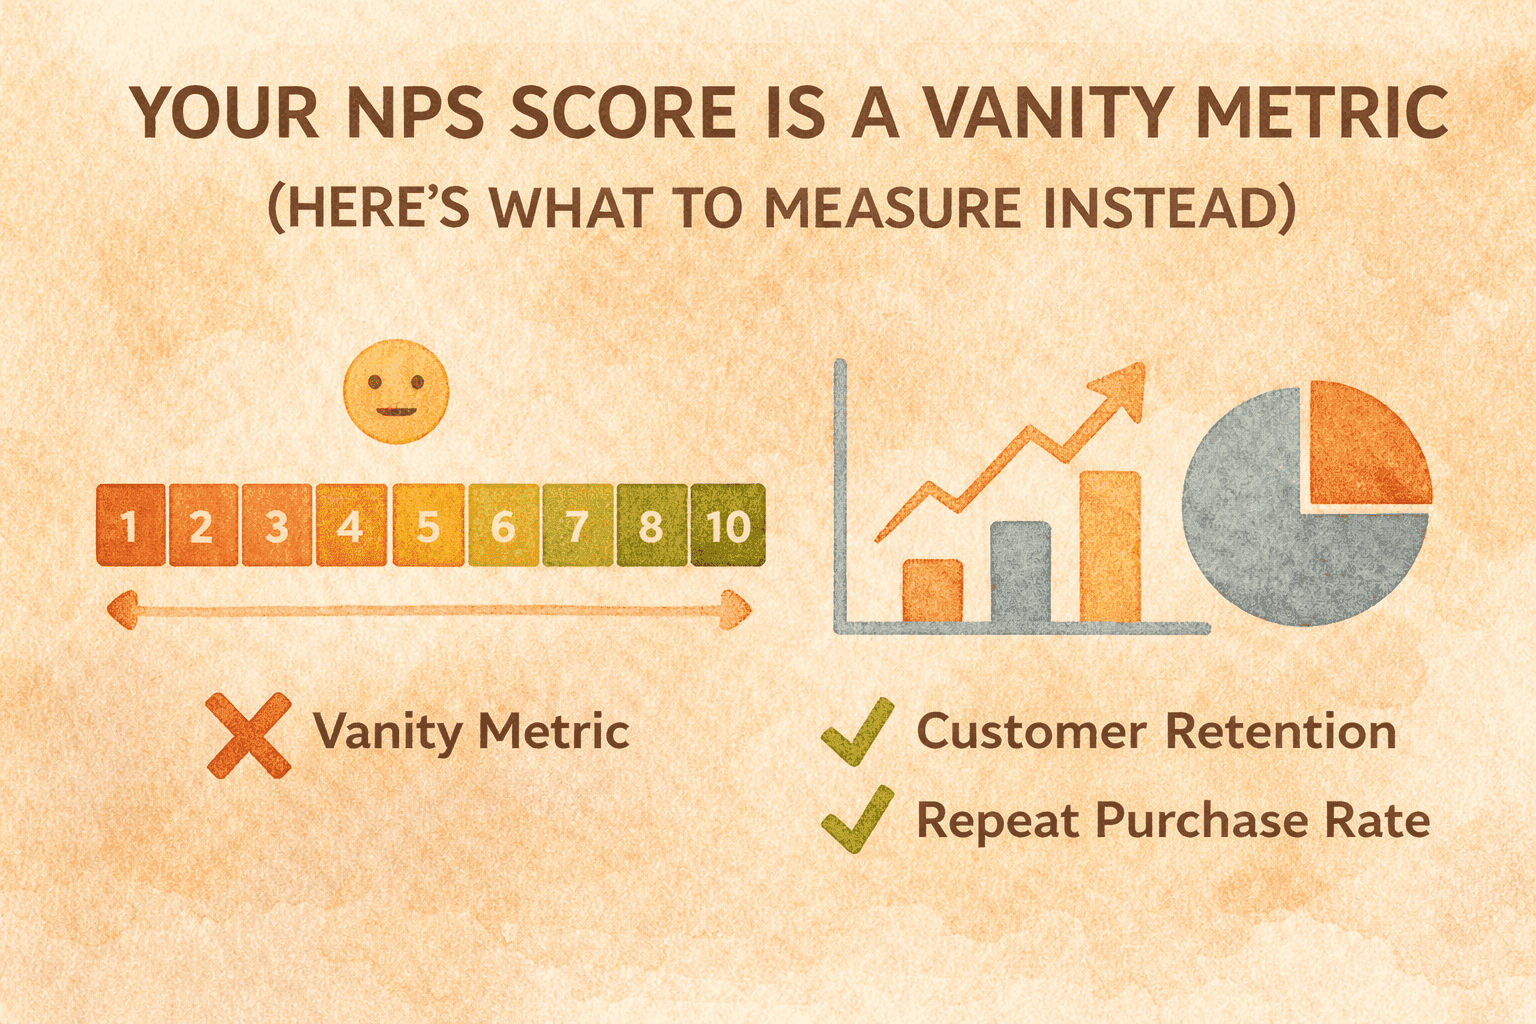
The Metric Everyone Measures and Nobody Trusts
In 2003, Fred Reichheld published "The One Number You Need to Grow" in Harvard Business Review. Net Promoter Score was born. Two decades later, two-thirds of Fortune 1000 companies use some version of NPS. It's embedded in dashboards, tied to executive compensation, and presented in every quarterly business review.
It's also increasingly useless.
75% of organizations struggle to act on NPS data. That prediction didn't fully materialize-but not because NPS proved its value. In 2024, NPS usage declined. Teams with less mature toolsets were actually more likely to use NPS (43%) than teams with stronger, more effective systems (30%). The problem isn't just the metric-it's that most companies never close the feedback loop to show customers their input matters.
The metric persists mostly where teams lack better alternatives.
Here's the uncomfortable truth: NPS measures stated intent, not actual behavior. A customer can rate you 9/10 on "likelihood to recommend" and never actually recommend you to anyone. They can score you as a promoter and still churn six months later. The gap between what people say they'll do and what they actually do is where NPS breaks down entirely.
A retention metric like KORE Score better predicts actual behavior. You can receive favorable scores while facing customer churn issues or lack of service expansion. The misalignment creates a false sense of security about customers' true sentiments-making it extremely difficult to forecast retention and growth.
You're measuring the wrong thing. And because you're measuring the wrong thing, you're optimizing for the wrong outcomes.
---
Why "Likelihood to Recommend" Doesn't Predict Retention
The fundamental premise of NPS is that customers who would recommend you are more loyal than customers who wouldn't. This seems logical. It's also empirically questionable.
Recommendation and retention are different behaviors with different drivers. A customer might love your product enough to recommend it while simultaneously planning to switch to a competitor offering better pricing. A customer might never recommend you-because they don't talk about purchases with friends-while remaining a loyal repeat buyer for years.
NPS doesn't directly predict retention. It also doesn't measure the level of customer engagement that contributes to a positive relationship between customer and brand. Some customers may be deeply loyal without ever promoting your brand or expressing that loyalty in surveys. Your NPS survey is missing them entirely.
The response bias compounds the problem. Only 10-15% of customers bother to respond to NPS surveys. This creates systematic feedback bias-you understand the experience of customers at the extremes but have no visibility into the silent majority who will determine your actual retention rate.
Consider what NPS actually captures:
- Promoters (9-10): Customers who say they'd recommend you. Some will. Many won't.
- Passives (7-8): Customers who are satisfied but unenthusiastic. The survey treats them as neutral, but they're actually your most vulnerable segment-satisfied enough not to complain, disengaged enough to switch.
- Detractors (0-6): Customers who say they wouldn't recommend you. Some will churn. Many won't-especially if switching costs are high.
The score itself-percentage of promoters minus percentage of detractors-obscures more than it reveals. An NPS of +30 could represent a company with 50% promoters and 20% detractors, or a company with 35% promoters and 5% detractors. These are radically different customer bases with radically different retention dynamics, collapsed into the same number.
NPS measures past experience. It tells you what happened-often when it's too late-not why it happened or what will happen next.
---
The Gaming Problem
When you tie metrics to incentives, people optimize for the metric rather than the underlying outcome. NPS is particularly vulnerable to gaming because the survey is simple and the manipulation is easy.
Employees ask customers to provide high scores. "If I've provided excellent service today, would you mind giving us a 10?" The customer, caught in a social interaction, complies. The score goes up. The actual experience doesn't change.
Support agents solve the easy tickets and escalate the hard ones-because resolution speed affects NPS more than resolution quality. Sales teams cherry-pick which customers receive surveys based on perceived satisfaction. Marketing times survey distribution to follow positive interactions rather than sampling the full customer journey.
Organizations with NPS systems often see gaming. Employees manipulate customer interactions to boost scores rather than genuinely improving customer experience. This focus on scores distorts priorities and behaviors within an organization.
The gaming problem is structural, not cultural. You can't solve it with better training or clearer guidelines. As long as a single number carries organizational weight, people will find ways to inflate it. The solution isn't better NPS discipline-it's measuring something that can't be gamed.
Behavioral metrics-what customers actually do rather than what they say-are inherently harder to manipulate. You can't game whether a customer made a repeat purchase. You can't inflate how often they visit your site. You can't manufacture engagement that didn't happen.
---
What Actually Predicts Retention
If NPS doesn't reliably predict retention, what does? The answer is behavioral data-observable actions that correlate with future purchasing behavior.
Customer Retention Rate (CRR)
The most direct measure of retention is... retention. What percentage of customers from a cohort are still purchasing after 30, 60, 90, 180, 365 days? This isn't a proxy. It's the thing itself.
retention rate measures customers kept. It's the opposite of churn rate, focusing on the positive aspect of customer loyalty. A high retention rate signals strong customer satisfaction-not because customers said they're satisfied, but because they demonstrated it through continued purchasing.
Customer Lifetime Value (CLV)
CLV predicts the total revenue a customer will generate over their entire relationship with your business. It factors in not just satisfaction but actual buying behavior over time.
Unlike NPS, CLV measures actual worth. A customer with declining CLV trajectory is at churn risk regardless of their survey responses. A customer with increasing CLV is demonstrating loyalty regardless of whether they'd "recommend" you.
Customer Effort Score (CES)
CES measures how easy it is for customers to accomplish their goals. 96% of customers, while reducing effort can lift repurchase intent by up to 94%.
Effort predicts behavior better than satisfaction. A customer can be satisfied with the outcome of an interaction while being exhausted by the process. That exhaustion accumulates. Eventually, they switch to a competitor not because they're dissatisfied with your product, but because dealing with you is too hard.
Churn Rate
Churn rate measures customers lost over a period. Unlike NPS, which might not directly predict churn, this metric gives a tangible measure of customer retention issues.
A high churn rate is an alarm. It tells you customers are leaving-not that they might leave, not that they're considering leaving, but that they've actually gone. By the time NPS flags a problem, churn rate has already quantified it.
---
The Behavioral Health Score Framework
The Behavioral Health Score (BHS) replaces survey-based sentiment with observable customer actions. Instead of asking customers how they feel, you measure what they do. Instead of a single score, you track a composite of behaviors that predict retention.
The Four Pillars of Behavioral Health
Pillar 1: Engagement Frequency
How often does the customer interact with your brand? This includes:
- Site visits (frequency and recency)
- Email opens and clicks
- App sessions
- Social media interactions
- Support contacts (both positive and negative signals)
Engagement trending down is an early warning sign-often appearing months before a customer would give negative survey feedback. Engagement trending up indicates deepening relationship regardless of stated satisfaction.
Pillar 2: Purchase Behavior
What does the customer's buying pattern reveal?
- Order frequency (trending up, stable, or declining)
- Average order value (expanding or contracting wallet share)
- Category breadth (buying from more or fewer categories)
- Discount dependency (purchasing only with promotions)
A customer whose order frequency is declining and discount dependency is increasing is at churn risk-even if they'd rate you 9/10 on likelihood to recommend.
Pillar 3: Advocacy Actions
Forget what customers say they'd do. Measure what they actually do:
- Referrals submitted (actual, not stated intent)
- Reviews written (and sentiment of those reviews)
- Social mentions (organic, not prompted)
- User-generated content shared
A customer who has written two positive reviews and referred three friends is a demonstrable promoter-regardless of their survey response.
Pillar 4: Support Dynamics
How does the customer interact with your support infrastructure?
- Ticket frequency (increasing or decreasing)
- Resolution satisfaction (immediate feedback, not separate survey)
- Self-service utilization (ability to solve problems independently)
- Escalation rate (how often issues require management involvement)
Increasing ticket frequency with declining resolution satisfaction predicts churn. Decreasing ticket frequency with high self-service utilization indicates a healthy, engaged customer.
Calculating the Behavioral Health Score
Each pillar generates a score from 0-100 based on the customer's position relative to your customer base. The composite BHS is a weighted average:
- Engagement Frequency: 25%
- Purchase Behavior: 35%
- Advocacy Actions: 15%
- Support Dynamics: 25%
The weights reflect predictive power for retention. Purchase behavior carries the most weight because it's the most direct indicator of customer commitment. Advocacy actions carry less weight because many loyal customers simply don't advocate publicly.
Interpreting BHS
- 80-100 (Healthy): Customer shows strong engagement, growing purchase behavior, and positive support dynamics. Retention probability: 90%+
- 60-79 (Stable): Customer maintains consistent patterns without significant growth or decline. Retention probability: 70-85%
- 40-59 (At Risk): Customer shows declining engagement or purchase patterns. Intervention recommended. Retention probability: 50-70%
- Below 40 (Critical): Customer shows multiple negative indicators. Immediate intervention required. Retention probability: Below 50%
Unlike NPS, BHS is actionable. A customer with declining BHS requires intervention. The specific pillars driving the decline tell you what kind of intervention. Low engagement pillar? Re-engagement campaign. Declining purchase pillar? Personalized offers. Poor support pillar? Proactive outreach from customer success.
---
Implementing the Transition
Abandoning NPS is organizationally difficult. The metric is embedded in dashboards, reports, and compensation structures. Leaders have been trained to care about it. Replacing it requires building new infrastructure and changing organizational habits.
Phase 1: Parallel Tracking (Months 1-3)
Don't eliminate NPS immediately. Instead, run behavioral metrics alongside it:
- Implement BHS calculation on your existing customer base
- Create dashboard showing NPS and BHS side by side
- Track correlation between NPS promoters/detractors and BHS healthy/critical segments
- Document cases where NPS and BHS diverge
The divergence cases are your ammunition. When a customer rated as a promoter churns, document it. When a customer rated as a detractor shows increasing purchase behavior, document it. Build the evidence base that NPS doesn't predict what matters.
Phase 2: Intervention Testing (Months 4-6)
Use BHS to drive retention interventions:
- Create intervention playbooks for each BHS risk tier
- Test interventions on BHS-identified at-risk customers
- Measure intervention success in terms of retention outcomes
- Compare intervention ROI against NPS-based targeting
If BHS-driven interventions outperform NPS-driven interventions-and they will-you have quantified evidence for the transition.
Phase 3: Organizational Transition (Months 7-12)
Begin shifting organizational focus from NPS to BHS:
- Update executive dashboards to lead with BHS
- Retrain customer success teams on BHS interpretation
- Adjust compensation structures to weight BHS-related outcomes
- Reduce NPS survey frequency (preserving trend data without organizational emphasis)
The goal isn't to eliminate customer feedback-it's to stop treating stated intent as equivalent to actual behavior.
---
What to Keep from NPS
NPS isn't entirely worthless. It has legitimate uses that behavioral metrics don't replace:
Competitive Benchmarking
Industry NPS benchmarks exist. Behavioral metrics don't have standardized cross-company comparisons. If you need to demonstrate customer satisfaction relative to competitors for investor relations or board reporting, NPS provides a recognized framework.
Industry benchmarks show wide variation. Companies like Starbucks (77%) and USAA (75%) are leaders, while others struggle with negative scores. This comparative context has value even if absolute NPS doesn't predict retention.
Qualitative Feedback Capture
The open-ended follow-up question ("Why did you give that score?") generates qualitative insights that behavioral data can't provide. Customers will tell you what's wrong in their own words. This verbatim feedback reveals product issues, service gaps, and improvement opportunities that numbers alone can't surface.
Keep the qualitative capture. Deprioritize the quantitative score.
Trend Analysis
If you've tracked NPS consistently for years, the trend data has value. A declining NPS trend-even if absolute NPS doesn't predict individual retention-signals organizational deterioration that warrants investigation.
Don't throw away historical data. Just stop treating NPS movement as the primary success indicator.
---
The Metrics Dashboard That Actually Matters
Replace your NPS dashboard with metrics that predict business outcomes:
Primary Metrics (Review Weekly)
- Retention Rate by Cohort: What percentage of customers from each monthly cohort are still active 30/60/90/180/365 days later?
- BHS Distribution: What percentage of your customer base is Healthy/Stable/At Risk/Critical?
- Revenue Retention: What percentage of last period's revenue came from returning customers?
- Intervention Success Rate: What percentage of BHS-triggered interventions resulted in retention?
Secondary Metrics (Review Monthly)
- CLV Trajectory: Is average customer lifetime value increasing or decreasing over trailing 12 months?
- Effort Score Trend: Is average customer effort increasing or decreasing?
- Advocacy Actions: How many referrals, reviews, and social mentions were generated?
- Support Health: What's the trend in ticket frequency, resolution time, and escalation rate?
Deprecated Metrics (Review Quarterly, if at all)
- NPS Score: Track for historical continuity and competitive benchmarking only
- CSAT Score: Replaced by behavioral indicators of satisfaction
- Survey Response Rate: No longer a success metric when surveys are deprioritized
---
The Cultural Shift
Moving beyond NPS requires changing how your organization thinks about customer success. The old model: ask customers how they feel, optimize for positive sentiment. The new model: observe customer behavior, optimize for retention outcomes.
This shift has implications:
Customer Success shifts from reactive to predictive. Instead of responding to negative survey feedback, teams intervene when behavioral indicators predict churn-before the customer has articulated dissatisfaction.
Marketing shifts from sentiment to action. Campaign success isn't measured by satisfaction with the campaign but by behavioral changes the campaign generates-increased engagement, higher purchase frequency, more referrals.
Product development shifts from feature requests to usage patterns. What customers say they want matters less than what features correlate with retention. Build for the behaviors that predict lifetime value, not the features that survey well.
Teams with mature CX toolsets use NPS less. The correlation is telling. Mature organizations have moved beyond the vanity metric. They measure what matters.
Your NPS score isn't telling you what you think it's telling you. The number goes up, the number goes down, and customers churn regardless. Stop optimizing for a metric that doesn't predict outcomes. Start measuring behavior. Start predicting retention. Start building a customer intelligence infrastructure that actually works.
The one number you need to grow isn't NPS. It's the percentage of customers who come back.
CAC : LTV Calculator
Lifetime value, payback and the ratio that decides whether you can afford to grow.
Your Feedback Loop is a Dead End (And How to Open It)
You Don't Know Which Customers Are About to Leave - And That's Negligent
Your "Customer Success" Team Is Just Support (support) with a Better Title
7 Ways To Use NPS For Growth
7 Customer Retention Metrics Every eCommerce Brand Must Track
How to Measure Product-Market Fit with Data
Newsletter
The Uncommon Insights Letter
Practical FMCG & eCommerce growth playbooks — margins, retention and scaling tactics, straight to your inbox.
Turn customer retention into profit you can see
Get a hands-on operator to turn the frameworks above into results — book a free audit call.