10 Metrics to Track Scaled Influencer Campaigns
Guide to the 10 essential metrics for scaling influencer campaigns — from reach and engagement to attribution, CPA and ROI.
17 February 2026
- Awareness Metrics: Tracking Campaign Reach
- Engagement Metrics: Measuring Audience Interaction
- The Hidden Metrics Behind High-ROI Influencer Campaigns
- Conversion Metrics: Tracking Actions and Results
- Retention and Long-Term Impact Metrics
- Financial Metrics: Measuring Campaign Efficiency
- Implementation Framework: Tools and Best Practices
- Conclusion
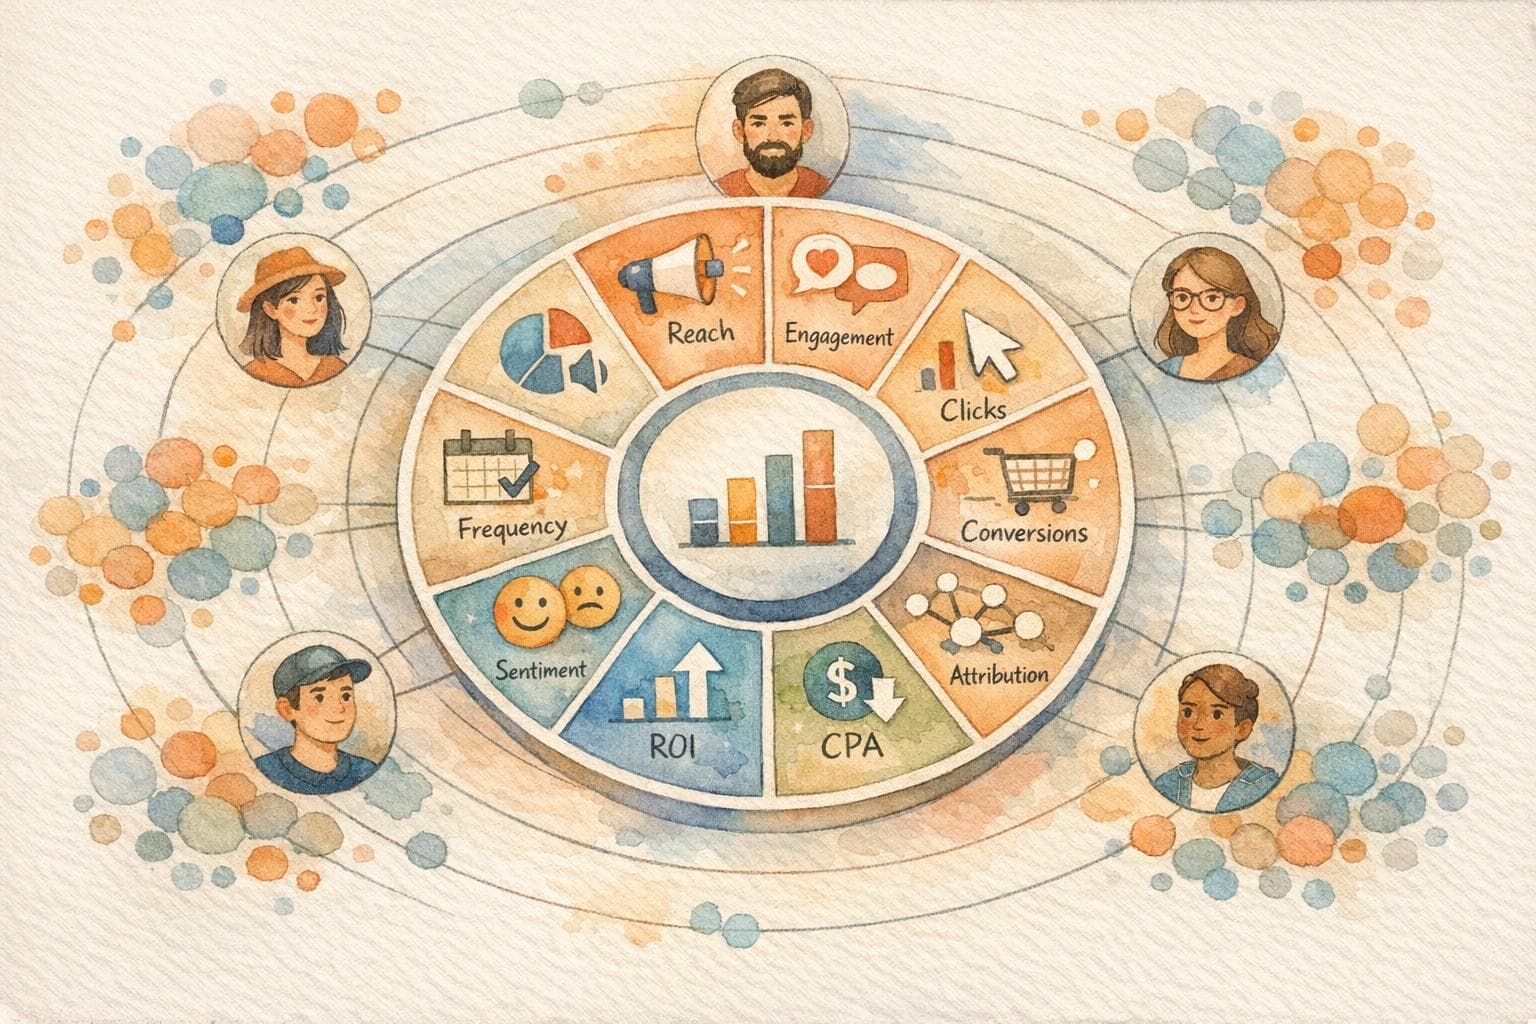
Managing influencer campaigns across platforms like TikTok, Instagram, and YouTube can get complicated, especially when scaling to dozens of creators. To measure success effectively, you need to focus on the right metrics. Here's a quick breakdown of the 10 key metrics every marketer should track for scaled influencer campaigns:
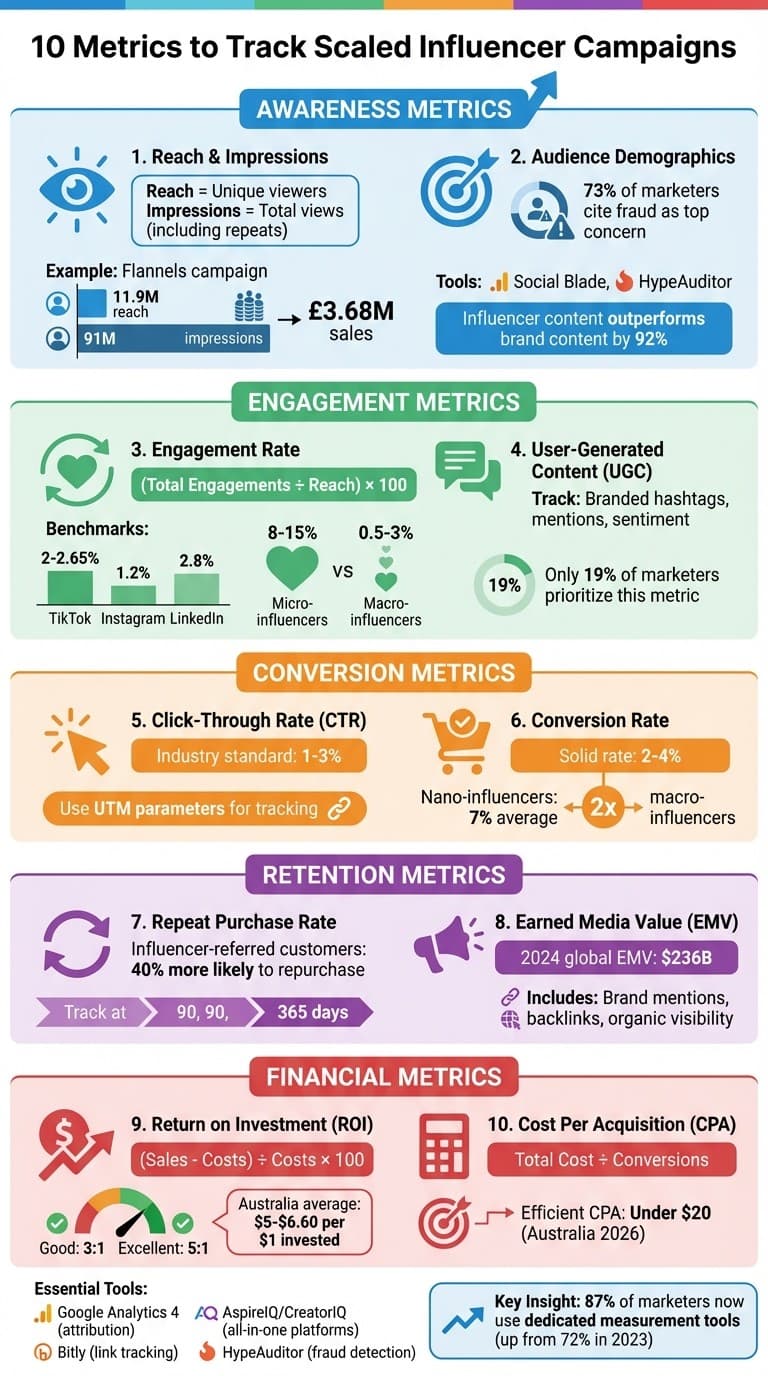
- Awareness Metrics: Include reach (unique viewers) and impressions (total views). These help gauge how many people see your content and how often.
- Audience Demographics: Ensure the influencer’s audience aligns with your target market. Tools like Social Blade or HypeAudience can help verify this.
- Engagement Rate: Measures likes, comments, shares, and saves as a percentage of views or followers. Engagement benchmarks vary by platform (e.g., TikTok: 2–2.65%, Instagram: 1.2%).
- User-Generated Content (UGC): Track branded hashtags, mentions, and sentiment to understand how audiences interact with your brand.
- Click-Through Rate (CTR): Indicates how many viewers clicked on a link. Use UTM parameters for tracking.
- Conversion Rate: Shows how many clicks lead to actions like purchases or sign-ups. Multi-touch attribution models help assign credit accurately.
- Return on Investment (ROI): Calculate campaign profitability by comparing sales generated to total costs.
- Cost Per Acquisition (CPA): Measures how much you spend to acquire each customer. Lower CPA indicates better efficiency.
- Retention Metrics: Track long-term impact, such as repeat purchases or follower growth over time.
- Earned Media Value (EMV): Measures unpaid visibility, including brand mentions and backlinks, to assess your campaign's ripple effects.
To streamline tracking, use tools like Google Analytics 4, Bitly, and platforms like AspireIQ or CreatorIQ. Consistent UTM naming and fraud detection tools are critical for accuracy. With these metrics, you’ll get a clear view of campaign performance, from awareness to ROI.
10 Essential Metrics for Tracking Scaled Influencer Campaigns
Awareness Metrics: Tracking Campaign Reach
Reach and Impressions
Reach reflects the number of unique individuals who see your content, while impressions count how many times it’s displayed, including repeat views. Think of reach as the size of your audience and impressions as the frequency of exposure.
Here’s a key difference: impressions will always be equal to or greater than reach. For example, if someone scrolls past your TikTok three times, that counts as three impressions but only one reach. Reach is a great indicator of how many people are becoming aware of your brand, while impressions help gauge how well your content is sticking with that audience.
"Reach shows your audience size. Impressions show content visibility. Use reach for budget planning. Use impressions to understand content resonance." – InfluenceFlow
Take Flannels, a UK fashion retailer, as an example. In late 2025, their #PartyNeverStops holiday campaign on TikTok reached 11.9 million unique users in the UK, generating an impressive 91 million impressions. The result? £3.68 million in sales and an 18x return on ad spend. As we move into 2026, tracking organic and paid reach separately becomes critical since algorithm changes are making organic visibility more challenging. Another helpful metric is branded search volume - an increase in direct searches for your brand name often signals success in building awareness. To capture delayed responses, use attribution windows of 7 to 30 days.
Once you’ve tracked reach, it’s equally important to ensure the audience you’re engaging aligns with your brand's target. That’s where demographic insights come in.
Audience Alignment and Demographics
High reach isn’t enough if the audience doesn’t match your ideal customer. Misaligned audiences can dilute your efforts, making authenticity checks essential. In fact, 73% of marketers in 2026 flagged influencer fraud as their top concern, underscoring the need for due diligence.
"A smaller audience that matches your target customer is more valuable than a massive disengaged audience." – InfluenceFlow
Before partnering with influencers, use tools like Social Blade or HypeAudience to analyse audience composition. Look for signs of bot activity or unusual spikes, and cross-check claimed demographics with platform analytics from Instagram, TikTok, or YouTube. For instance, if an influencer claims a Sydney-based audience but data shows a significant portion from high-bot regions, that’s a red flag.
In Australia, Meta platforms reveal that the largest adult demographic is aged 25–34, accounting for 12.9% of both male and female users. If your campaign targets Gen Z but the influencer’s audience leans older, even impressive reach numbers won’t translate into meaningful results.
To measure effectiveness, assign UTM parameters and unique discount codes to each influencer. This allows you to track which audience segments are converting. Combine this with social listening tools to monitor brand mentions and sentiment, ensuring the audience’s reaction aligns with your brand’s values. Interestingly, influencer content has been shown to outperform brand-owned content by up to 92% in reach, engagement, and conversions when the audience aligns with your ideal customer profile.
Engagement Metrics: Measuring Audience Interaction
Engagement Rate
Engagement rate is a key indicator of whether your audience is actively interacting with your content or simply scrolling past. While reach tells you how many people saw your post, engagement rate digs deeper, measuring actions like likes, comments, shares, and saves.
For larger campaigns, Engagement Rate by Reach (ERR) is a dependable metric. It’s calculated as:
(Total Engagements ÷ Reach) × 100.
When assessing influencers, you might use Engagement Rate by Post, which is:
(Total Engagements ÷ Total Followers) × 100.
For video content on platforms like TikTok and Instagram Reels, a tailored formula applies:
(Likes + Comments + Shares + Saves ÷ Views) × 100.
"Engagement rate matters most. It shows real audience interaction. Follower count can be bought. Engagement rate shows authenticity." – InfluenceFlow
Engagement benchmarks differ across platforms. TikTok typically sees engagement rates between 2% and 2.65%, Instagram hovers around 1.2%, and LinkedIn averages 2.8%. Micro-influencers (10,000–100,000 followers) often achieve engagement rates of 8% to 15%, while macro-influencers (over 1 million followers) usually range from 0.5% to 3%. This explains why 78% of brands now prioritise engagement rate over follower count when choosing influencer partners.
It’s also worth noting that not all engagement types are equal. For instance, Instagram assigns higher value to comments - three times more than likes - and actions like shares and saves can significantly boost content visibility. Saves indicate content is worth revisiting, while shares reflect personal endorsement within networks. Regularly auditing engagement metrics can help verify authenticity. Be cautious of sudden engagement spikes without corresponding follower growth or an influx of generic comments like "Nice post!" - these can signal bot activity.
Beyond traditional metrics, audience sentiment and user-generated content (UGC) provide even more nuanced insights.
User-Generated Content Volume and Sentiment
Tracking user-generated content offers a closer look at how your audience interacts with and advocates for your brand. When people create posts using your hashtags, duet your videos, or mention your brand unprompted, it’s a sign of genuine interest. Use branded hashtags, mentions, and social listening tools to monitor UGC volume. Sentiment analysis tools can further classify the tone of this content - positive, negative, or neutral.
Interestingly, only 19% of marketers currently prioritise UGC as a metric, despite its proven impact. Positive sentiment, such as comments like "This is so helpful!" compared to dismissive ones like "Ad skip", can signal strong audience connection and potential for conversions.
"Engagement metrics matter because influencer content is directly shaping purchase behaviour and brand trust." – Sprout Social
Tracking UGC volume and sentiment isn’t just about understanding your audience - it’s also a tool for refining influencer campaigns. Metrics like saves and shares reveal the value audiences place on your content, while tagging UGC by format (e.g., unboxing videos versus testimonials) can highlight which types perform best. Establish baseline metrics for both social and web data before launching campaigns to accurately measure the impact of influencer-driven UGC.
The Hidden Metrics Behind High-ROI Influencer Campaigns
Conversion Metrics: Tracking Actions and Results
Once awareness and engagement are in place, conversion metrics step in to show whether influencer-driven traffic leads to meaningful outcomes.
Click-Through Rate and Traffic Attribution
Conversion metrics focus on results that directly impact business goals. One key metric is the click-through rate (CTR), which measures the percentage of viewers who click on an influencer’s link. To calculate CTR, divide the number of clicks by the total impressions. For influencer campaigns, the industry standard typically ranges between 1% and 3%.
To track influencer-driven traffic effectively, use UTM parameters - tags added to URLs that help identify where visitors come from. The five essential UTM parameters include:
- utm_source: Identifies the influencer (e.g., their name).
- utm_medium: Specifies the channel type (e.g., "social").
- utm_campaign: Names the campaign.
- utm_content: Describes the content type (e.g., "ig_reel").
- utm_term: Adds optional categorisation.
When managing multiple influencers, consistent naming is crucial. Stick to lowercase letters and hyphens (no spaces or special characters) to ensure clean and accurate data tracking in Google Analytics 4.
"UTM parameters ROI is the fastest way to stop guessing which influencers drive real business results and start proving it with clean, comparable data." – Jordan Kim, Creator Economy Reporter, InfluencerDB
To capture conversions from "dark social" - when users see a post but visit your site later without clicking - combine UTM-tagged links, unique promo codes, and dedicated landing pages. Always test links on mobile devices since most influencer traffic comes from mobile apps. Tools like Bitly can shorten long UTM links for a cleaner look in Instagram bios and Stories.
Take Blueland’s April 2025 campaign as an example. The eco-friendly brand worked with 211 micro-influencers via Stack Influence to boost Amazon sales. Over three months, the campaign generated 247,932 impressions and 11,451 engagements, achieving a 4.6% engagement rate. With an investment of A$9,917, the campaign drove A$129,280 in revenue, delivering a 13× ROI.
Once you’ve driven traffic, the next step is figuring out how it converts into measurable actions.
Conversion and Sales Attribution
Conversion metrics reveal whether the traffic influencers generate leads to valuable actions - like purchases, sign-ups, or downloads. A conversion rate of 2–4% is considered solid for influencer-driven campaigns. To calculate it, divide total conversions by clicks and multiply by 100.
One challenge in larger campaigns is determining which influencer deserves credit when customers engage with multiple creators before converting. This is where multi-touch attribution comes into play.
- Linear attribution: Distributes credit equally across all touchpoints.
- Time-Decay attribution: Gives more credit to recent interactions.
- U-Shaped attribution: Focuses on the first and last touchpoints.
Brands using multi-touch attribution report 73% more precise ROI calculations compared to those relying solely on last-click attribution.
The attribution window should match the product’s purchase behaviour. For quick eCommerce or FMCG purchases, a 7–14-day window works well. For high-consideration items, a 30-day window is more appropriate. To counter iOS 14.5+ privacy restrictions on browser pixels, use server-side conversion APIs. These APIs send conversion data directly to analytics platforms, ensuring accuracy even with strict privacy settings.
Interestingly, nano-influencers (1,000–10,000 followers) outperform larger creators in conversions, achieving an average rate of 7% - more than double the 3% rate of macro-influencers. They also deliver a 40% lower cost-per-acquisition and a 5.5× ROI compared to the 3.2× ROI of macro-influencers. This explains why 78% of marketers now prioritise selecting influencers based on data.
These metrics provide a comprehensive view of influencer campaign performance, highlighting the importance of data-driven strategies.
Retention and Long-Term Impact Metrics
Once you've analysed reach, engagement, and conversions, it's time to tackle the bigger picture: long-term metrics. These help you understand whether your influencer campaigns have a lasting impact. While conversion data shows immediate outcomes, retention metrics dig deeper, revealing if those new customers stick around and continue engaging with your brand.
Audience Growth Attribution
Retention metrics go beyond the initial buzz. They help determine if your campaign fosters ongoing customer loyalty. One way to measure this is by tracking follower growth and using incrementality testing to pinpoint the growth directly linked to your influencer campaign. This involves comparing a control group (not exposed to the campaign) with a test group (exposed) to identify the specific lift your campaign generates.
To evaluate long-term impact, monitor follower growth at intervals like 30, 90, and 365 days. Pair this with tools like unique promo codes or affiliate links integrated into your CRM to track both first-time and repeat purchases. Google Analytics 4’s "assisted conversions" feature can also highlight influencers who sparked initial awareness, even if the final purchase came through a different channel.
"A campaign that looks great after three months might completely fail by month twelve." – InfluenceFlow
Another critical metric is the repeat purchase rate. Data shows that customers referred by influencers are 40% more likely to make repeat purchases compared to the average customer. Analysing the time between their first and subsequent purchases can provide a clear picture of their loyalty and how influencer efforts contribute to customer lifetime value (CLV).
These insights lay the groundwork for evaluating the organic ripple effects of your campaign through earned media and brand mentions.
Brand Mentions and Earned Media
Earned media acts as a "reputation dividend", offering ongoing, unpaid visibility that keeps delivering value long after your campaign ends. Unlike paid ads, earned media builds lasting assets - such as press mentions and organic conversations - that shape public perception and drive traffic over time.
In 2024, influencers were estimated to generate A$236 billion in Earned Media Value (EMV) worldwide. To calculate your share, use social listening tools to track brand mentions across platforms. Then, apply industry-standard metrics like CPM (Cost Per Mille) or CPE (Cost Per Engagement) to translate that organic buzz into measurable dollar value. Additionally, monitoring Share of Voice (SOV) - the proportion of brand mentions compared to competitors within specific influencer communities or hashtags - can reveal shifts in your market position.
Sentiment analysis adds another layer of insight. AI-driven tools like Brandwatch or Sprout Social can help you gauge whether the mentions and discussions sparked by your campaign are positive, negative, or neutral. Running brand lift surveys at 30, 60, and 90 days post-campaign can further measure increases in brand awareness and preference.
Don’t overlook the SEO benefits of earned media. High-authority backlinks from press mentions or influencer content can drive referral traffic that often performs better than other sources. For example, online press releases tend to generate a 12% higher goal completion rate. YouTube content, in particular, can deliver long-term SEO value, as archived videos continue to boost traffic and brand mentions for years.
Finally, consider the "halo effect" of influencer campaigns. These efforts can enhance the performance of your owned media, with organic social posts often seeing up to 30% better engagement during active campaign periods. By comparing your owned media metrics before, during, and after the campaign, you can gain a clearer understanding of its broader impact.
Financial Metrics: Measuring Campaign Efficiency
Once you've tracked reach, engagement, and retention metrics, it's time to evaluate your campaign's profitability. Financial metrics show whether your investment delivered results and how effectively each dollar was spent. These indicators help complete the picture of your campaign's overall performance.
Return on Investment (ROI)
ROI answers a simple but crucial question: was your campaign profitable? The formula is straightforward:
(Sales Attributed to Campaign - Total Campaign Costs) ÷ Total Campaign Costs × 100.
A ratio of 3:1 is considered solid, while 5:1 is exceptional. On average, campaigns in Australia return between A$5.00 and A$6.60 for every dollar invested.
To get an accurate ROI, include all costs - this means influencer fees, product costs, shipping, taxes, team hours, software subscriptions, and even payment processing fees (usually 2–3%). Ignoring hidden costs can inflate ROI by as much as 30–50%.
Proper attribution is another critical factor. The position-based model (40/20/40) is the 2026 standard for scaled campaigns. It assigns 40% credit to the influencer who sparked awareness, 40% to the final touchpoint, and 20% to middle interactions. To refine this further, use incrementality testing. By comparing a control group (no influencer exposure) to a test group, you can measure the actual lift in performance and avoid overstating ROI by up to 60%.
The type of influencer you choose also impacts ROI. Nano-influencers (10,000–50,000 followers) often deliver returns of 7:1 to 10:1, while mega-influencers (1 million+ followers) typically achieve more modest returns of 2:1 to 3:1. For a complete picture, track ROI over 30, 60, and 90-day periods to account for repeat purchases. Influencer-referred customers often have a 15–25% higher lifetime value compared to those from other digital channels.
"Typically, when teams look at Meta ads ROI (or ROAS), they're looking at the cost of reach alone... Whereas in influencer marketing, you look at the amount you pay influencers, which includes everything – content production, reach, plus the trust factor." – Ryan Prior, Head of Marketing, Modash
Cost Per Acquisition (CPA)
Once you’ve calculated ROI, dive deeper into cost efficiency with CPA.
CPA measures how much you’re spending to acquire each customer. The formula is simple:
Total Campaign Cost ÷ Number of Conversions.
For most Australian consumer brands in 2026, a CPA under A$20.00 is considered efficient.
To improve tracking accuracy, use UTM parameters combined with unique promo codes to capture conversions from "dark social" platforms. This dual method can increase attribution accuracy by 40%. Since research shows 73% of marketers struggle with influencer attribution, layered tracking is now essential.
If a creator drives significant traffic but few conversions, it’s worth investigating. Check your landing page performance or refine your CTAs and pinned comments. With 58% of global online traffic coming from mobile devices, ensuring your links and pages are mobile-friendly is critical to keeping CPA low.
To optimise your partnerships, categorise creators by CPA performance into "Kill/Sustain/Scale" buckets. This approach helps you quickly identify which collaborations are worth growing and which ones are draining your resources without delivering results.
Implementation Framework: Tools and Best Practices
To measure the 10 metrics effectively, you need a solid framework equipped with the right tools and strategies. Managing metrics for multiple creators across various platforms can be complex, and spreadsheets alone won't cut it anymore. By 2026, 87% of marketers are using dedicated measurement tools - up from 72% in 2023. This shift highlights the growing need for robust systems to handle the demands of scaled campaigns. Below, we dive into the tools and practices that form the foundation of a reliable measurement system.
Tracking Tools
Your tracking setup should cover six core areas: planning, creator management, asset storage, attribution, reporting, and social listening. Start by leveraging native analytics tools like Instagram Insights, TikTok Creator Centre, and YouTube Analytics. Then, fill in any gaps with additional platforms.
For tracking traffic and attribution, Google Analytics 4 remains the go-to tool. Pair it with Bitly for link shortening and basic click tracking. Affiliate platforms such as Impact, Refersion, or ShareASale are ideal for cookie-based attribution over 30–90 days, particularly for performance partnerships.
If you're looking for an all-in-one solution, platforms like AspireIQ, Grin, CreatorIQ, and Upfluence centralise essential functions like discovery, CRM, reporting, and payments. However, these come with higher costs, typically ranging from A$1,000 to A$5,000+ per month. For startups or smaller businesses, a DIY stack using tools like Google Analytics, Bitly, Airtable, and InfluenceFlow (which offers a free tier) can cover most measurement needs without breaking the bank.
Fraud detection tools are equally important. Options like HypeAuditor (A$300–A$1,500/month), Modash (A$150–A$750/month), and Social Blade can help verify audience authenticity. With 15–18% of influencer accounts showing fake engagement or followings [47,48], this step is crucial before signing any contracts. Finally, centralised dashboards such as Google Looker Studio or Metabase can aggregate data from multiple APIs into a single, easy-to-read view. By 2026, 78% of marketers are using analytics dashboards to track campaign performance.
Data Accuracy and Scalability
Even the most advanced tools won't help if your data is messy. Consistency is key. Standardise UTM naming by using lowercase, hyphens, and a consistent structure. Pair this with unique promo codes (e.g., SARAH20) to capture conversions that happen off-link.
Jordan Kim, a Creator Economy Reporter, sums it up perfectly:
"If you cannot name your source and medium consistently, you will not be able to compare creators side by side".
Before launching any links, double-check that they work seamlessly on both mobile and desktop, ensure UTM parameters are intact, and verify that landing pages load correctly [23,50].
Keep a master tracking spreadsheet or CRM updated with every influencer's details, including unique links, agreed fees, and posting dates. Conduct quarterly audits to ensure that links, discount codes, and reported dates align with raw analytics data. With 73% of marketers finding it challenging to measure influencer ROI accurately, this level of detail is essential for making smart decisions at scale.
Conclusion
Influencer marketing becomes a precise, data-driven strategy when you focus on the right metrics. The 10 metrics outlined here - covering awareness, engagement, conversion, retention, and financial performance - offer a detailed view of campaign performance at every stage of the sales funnel. Without these insights, achieving consistent and measurable results becomes a challenge.
Each metric serves a specific purpose in driving campaign success. For instance, aligning metrics with your goals is crucial. If your aim is to boost brand awareness, prioritise metrics like reach and impressions. On the other hand, if profitability is your target, concentrate on CPA and ROI. Kurtis Smeaton, Influencer Marketing Manager at Later, explains it well:
"It lets you establish whether your campaign will be a TOFU, MOFU, or BOFU play".
This kind of strategic planning is especially important as brands are projected to invest A$47.8 billion in influencer marketing advertising by 2027.
Tracking success effectively requires more than just spreadsheets. With 87% of marketers now relying on dedicated measurement tools, building a robust tracking system is vital. Tools like UTM parameters, unique promo codes, fraud detection systems, and centralised dashboards ensure campaigns are both scalable and efficient. This approach not only addresses immediate challenges but also lays the groundwork for long-term growth.
FAQs
Which metrics matter most for my campaign goal?
When determining the right metrics, it all comes down to your campaign’s objectives. For brand awareness, look at metrics like reach, impressions, and engagement rate. If your focus is on driving conversions or sales, keep an eye on clicks, conversion rate, and cost per acquisition (CPA). For broader, long-term goals like building brand loyalty, metrics such as brand sentiment, audience growth, and earned media value (EMV) are key. The trick is to align your tracking with your goals so you can measure results and make improvements effectively.
How do I track sales when people don’t click the link?
Tracking sales without relying solely on direct link clicks involves a few clever strategies. For starters, UTM parameters can be added to URLs to track where traffic originates, giving you a clear picture of which sources are driving visitors. Another option is using unique coupon codes assigned to each influencer, making it easy to attribute purchases to the right campaign.
You can also leverage tracking pixels, which collect data on user behaviour, or create dedicated landing pages tailored for specific campaigns or influencers. To go even deeper, multi-touch attribution models can provide insights into the entire customer journey, helping you understand how influencer campaigns contribute to sales across multiple touchpoints.
What’s the simplest way to spot influencer fraud fast?
The fastest way to spot influencer fraud is by keeping an eye out for warning signs. These include engagement rates that seem too high for the follower count, sudden surges in followers, or engagement patterns that feel off. To back up your concerns, use fraud detection tools to verify the authenticity of the account.
Related Blog Posts
How To Align Metrics For Influencer And Affiliate Campaigns
Common Pitfalls in Social Media ROI Analysis
How To Measure Content Marketing ROI For eCommerce
Customer acquisition cost by channel analysis
How to Map DTC Customer Touchpoints
Ultimate Guide to Social Media Sentiment Monitoring
Newsletter
The Uncommon Insights Letter
Practical FMCG & eCommerce growth playbooks — margins, retention and scaling tactics, straight to your inbox.
Turn these ideas into profit you can see
Get a hands-on operator to turn the frameworks above into results — book a free audit call.