Ultimate Guide to Mobile Ad KPIs
Practical guide to mobile ad KPIs and Australian benchmarks — covering acquisition, engagement, retention, revenue metrics, tracking tools and optimisation tips.
15 January 2026
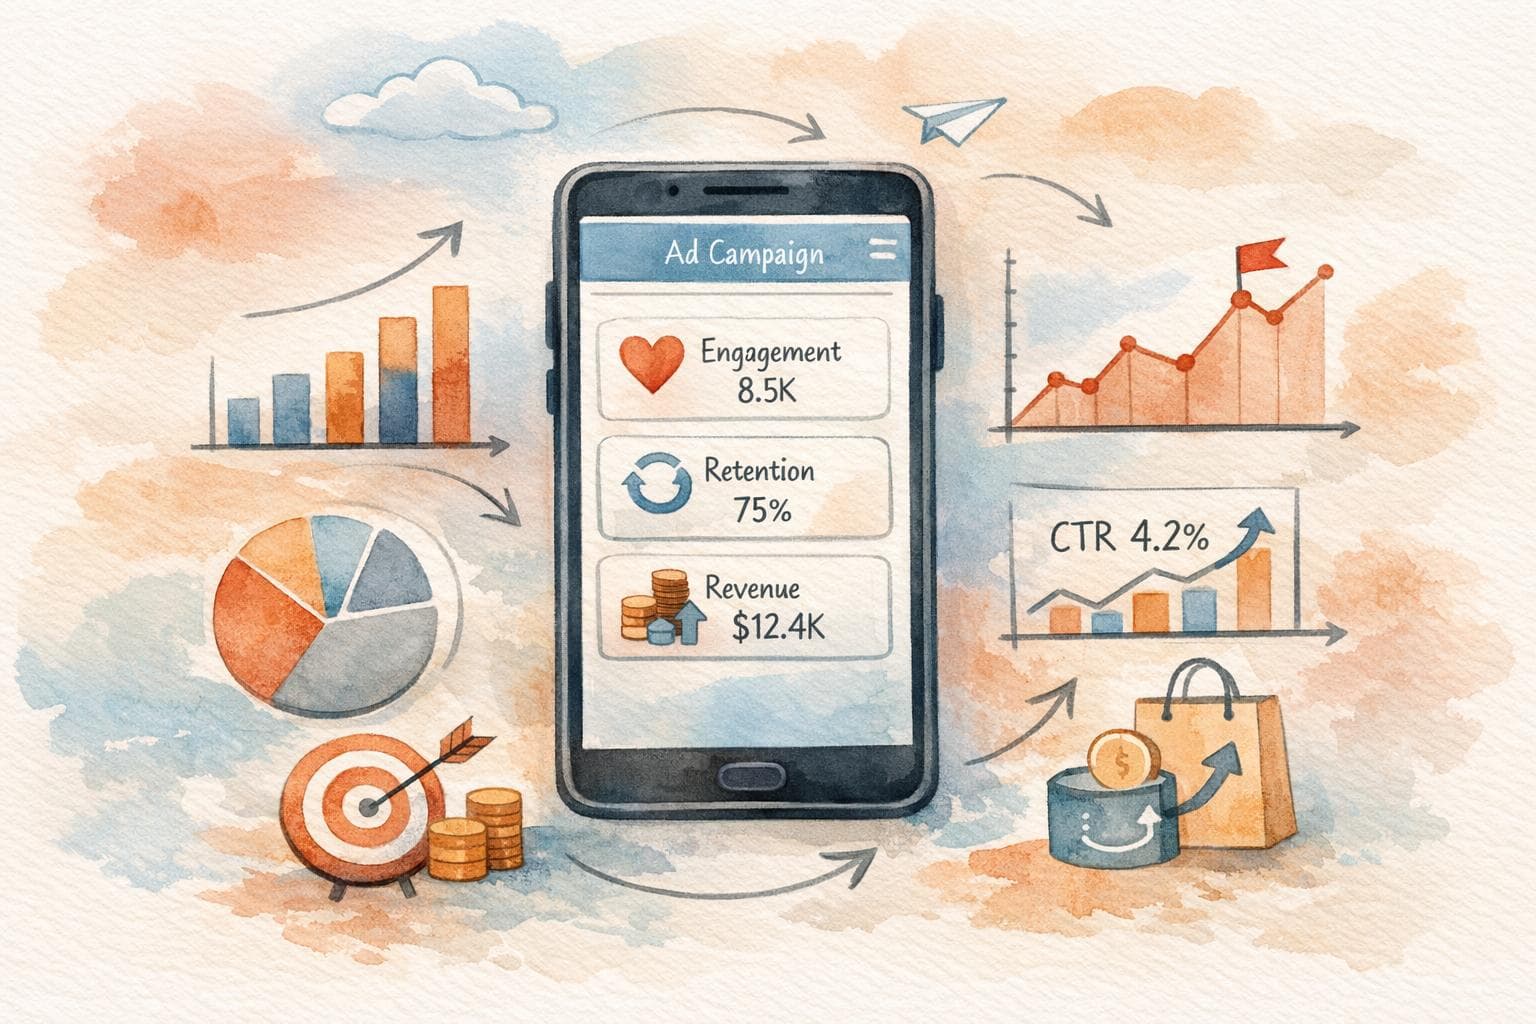
Mobile ad KPIs are the backbone of effective campaigns, helping you measure app installs, user engagement, retention, and revenue. For Australian businesses, where 68% of online purchases are made on mobile devices and mobile ad spending surpasses AU$5 billion, tracking these metrics ensures your marketing dollars deliver results. Key takeaways include:
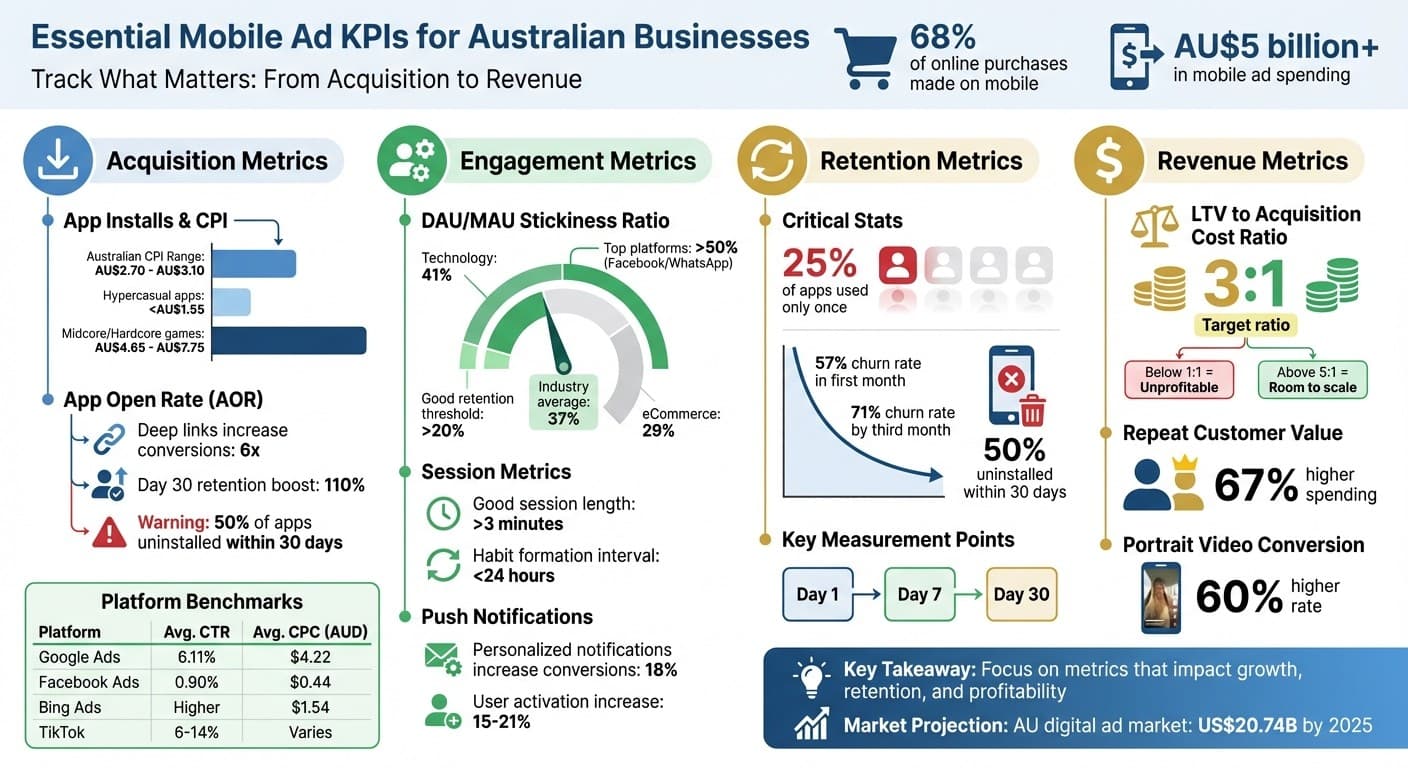
- Acquisition Metrics: App Installs, Cost Per Install (CPI), and App Open Rate (AOR) reveal how well your campaigns attract and activate users. For example, Australian CPIs range from AU$2.70–AU$3.10, depending on the app category.
- Engagement Metrics: Daily Active Users (DAU), Monthly Active Users (MAU), and session data highlight how users interact with your app. Apps with a stickiness ratio above 20% often see better retention.
- Retention Metrics: Retention and churn rates track user loyalty. Nearly 50% of apps are uninstalled within 30 days, making Day 1, Day 7, and Day 30 retention rates critical.
- Revenue Metrics: Average Revenue Per User (ARPU) and Lifetime Value (LTV) help assess profitability. Aim for a 3:1 LTV to acquisition cost ratio for sustainable growth.
To optimise performance, integrate tools like AppsFlyer for tracking, compare your KPIs to local benchmarks, and focus on data-driven decisions. Australia's growing mobile commerce market demands precise tracking to stay competitive.
Mobile Ad KPIs: Key Metrics and Australian Benchmarks for App Success
Top 10 Mobile App Metrics & KPIs (Explained) 📈
Mobile Ad Acquisition KPIs
When it comes to mobile advertising, it's not just about getting your ads out there - it's about ensuring they reach the right audience and convert impressions into active, engaged users. These acquisition metrics help measure how effectively your campaigns turn interest into action, moving beyond downloads to gauge genuine user engagement.
App Installs and Downloads
App installs are the first sign of success, reflecting how many users have downloaded your app. This metric gives you a sense of your campaign's reach and initial growth rate. But here's the catch: installs only matter if users actually open the app. Tracking organic installs (users who find your app naturally) versus non-organic installs (from paid ads) helps you understand whether your advertising efforts are driving broader visibility and organic discovery.
To improve conversion rates, focus on portrait-oriented videos - they deliver a 60% higher conversion rate. Additionally, provide a mix of at least 20 images and 20 videos in different aspect ratios (16:9, 1:1, 2:3) to tailor your content to various audience preferences.
Once you've got the installs, it's time to evaluate the cost-effectiveness of your efforts with the Cost Per Install metric.
Cost Per Install (CPI)
CPI tells you how much you're spending to acquire each new user. The formula is simple: divide your total ad spend by the number of installs. For example, if you spend AU$1,000 and gain 500 installs, your CPI is AU$2.00. In Australia, CPIs in developed markets typically range from AU$2.70 to AU$3.10, but this varies depending on the app category. Hypercasual apps often have CPIs under AU$1.55, while midcore and hardcore games see higher CPIs, ranging from AU$4.65 to AU$7.75.
To bring down your CPI, consider using "Target CPI" bidding, which automates bids to meet a specific cost goal. For best results, set your average daily budget at 50 times your target CPI so the algorithm has enough data to optimise effectively. Keep in mind that early CPI metrics might be inflated due to conversion lag, so give your campaigns time to stabilise. When adjusting your budget, avoid changes of more than 20% at a time to maintain campaign stability.
For a more accurate understanding of your campaign’s impact, calculate an "adjusted CPI" by factoring in View-Through Conversions (VTCs) - users who install your app after seeing, but not clicking, your ad.
Once you've nailed down CPI, the next key metric is understanding how many of those users actually engage with your app - enter the App Open Rate.
App Open Rate (AOR)
AOR measures the percentage of users who open your app after installing it. The formula: (Total Opens / Total Installs) × 100. This metric is a clear indicator of whether your app is attracting users who are genuinely interested, rather than those who download it by accident or out of fleeting curiosity.
A high AOR signals that your ad messaging aligns well with the app's actual experience. On the other hand, a low AOR could mean your ads are either reaching the wrong audience or setting unrealistic expectations. To improve AOR, use deep links to direct users to specific in-app content - like a product page or a game level - rather than a generic home screen. Deep links can increase conversion rates by up to six times and boost day 30 retention rates by 110%.
Tools like Firebase or third-party analytics platforms can help you track "first opens" as a conversion, confirming genuine user interest. Keep in mind that nearly 50% of all apps are uninstalled within 30 days of installation. A strong AOR can be your first line of defence against this trend, ensuring your app remains relevant and engaging for users.
Mobile Ad Engagement KPIs
Engagement metrics help determine if users acquired through ads are actively interacting with your app. These metrics form the basis for analysing user retention and revenue trends, which are explored in later sections.
Daily Active Users (DAU) and Monthly Active Users (MAU)
Daily Active Users (DAU) refers to the number of unique users engaging with your app in a 24-hour period, while Monthly Active Users (MAU) tracks unique users over a 30-day span. The stickiness ratio, calculated as (DAU/MAU) × 100, reflects how often users interact with your app daily.
"A strong DAU/MAU ratio points to habitual usage, while a low one can be an early warning sign of churn or weak product-market fit." – Team Braze
In 2023, the average stickiness ratio across industries was 37%. Apps in the technology sector averaged 41%, while eCommerce apps lagged slightly behind at 29%. Generally, a ratio above 20% signals good user retention. Leading platforms like Facebook and WhatsApp often exceed 50%. However, the definition of "active" varies - whether it's simply opening the app, making a purchase, or spending a set amount of time in-app. Analysing these metrics by acquisition source can highlight which channels bring in the most engaged users.
Session Length and Session Interval
Session length measures how much time users spend in your app per visit, while session interval tracks the time between their visits. Longer sessions usually indicate deeper user engagement, while shorter intervals suggest habitual usage.
"Longer or more regular sessions often signal deeper engagement or better UX. Shorter intervals suggest habit formation and app stickiness." – Team Braze
A session length of over three minutes is a positive sign, showing users are engaged, while an interval of less than 24 hours indicates daily app usage. Ad campaigns play a role here - effective creatives and targeting attract users whose expectations align with your app’s offerings. If session length decreases after an update, it could signal issues like bugs, performance problems, or unpopular design changes. On the other hand, high session lengths combined with low conversion rates might point to friction in the user journey.
Push Notification Opt-in Rate and CTR
The push notification opt-in rate - calculated as (Users who enabled push notifications / Total users) × 100 - shows how many users are reachable for re-engagement. The click-through rate (CTR), measured as (Push opens / Pushes delivered) × 100, reflects how many users interact with delivered notifications. Personalised push notifications can increase conversion rates by 18%.
For example, eCommerce and streaming apps have seen user activation rise by 15–21% through personalised, interactive notifications. To improve opt-in rates, use contextual onboarding to explain the value of notifications before requesting system permissions. Regularly test notification copy, timing, and even emoji use to optimise CTR.
Mobile Ad Retention and Monetisation KPIs
Once users start engaging with your app, the real challenge begins: keeping them around and turning their activity into revenue. Retention and monetisation metrics help you understand if your ad campaigns are attracting users who not only stay but also contribute to your app's success.
Retention Rate and Churn Rate
Retention rate shows how many users return to your app after a certain period - commonly measured on Day 1, Day 7, or Day 30 after installation. On the flip side, churn rate tracks the percentage of users who leave or uninstall your app within the same timeframe. Here's how they're calculated:
- Retention Rate = (Users active at the end of the period / Users active at the start) × 100
- Churn Rate = (Users lost during the period / Users at the start) × 100
"Retention rate is one of the most important mobile engagement KPIs because if users don't stick around, nothing else matters." – Team Braze
Here’s a stark reality: about 25% of mobile apps are used only once before being abandoned, and the average churn rate hits 57% within the first month, climbing to 71% by the third month. Nearly half of all apps are uninstalled within 30 days. These numbers often indicate issues like poor onboarding, app crashes, or failure to deliver value.
To improve retention, you can:
- Simplify onboarding with third-party logins like Google or Facebook.
- Use predictive modelling to spot users who might churn early (e.g., those with declining session frequency) and re-engage them with personalised campaigns.
- Implement deep linking to customise onboarding experiences, which can increase Day 30 retention by 110%.
- Ensure a crash-free session rate close to 100%, as technical glitches are a major driver of uninstalls.
Once retention is under control, the next step is to measure how effectively your app converts user engagement into meaningful actions.
Conversion Rate
Conversion rate measures the percentage of users who complete a desired action - whether it’s making a purchase, subscribing, or finishing a tutorial - after engaging with your ad. This metric highlights how well your ads, targeting, and app experience work together.
Personalisation plays a huge role in boosting conversions. For example:
- American Dairy Queen used mobile messaging to test welcome offers, leading to a 138% jump in revenue.
- Styli, a fashion app, leveraged personalised push campaigns and Content Cards to achieve a 15% increase in user activation and a 21% rise in sign-ups.
By segmenting users based on behaviour or lifecycle stage - such as targeting new users who haven’t completed onboarding - you can tailor your messaging to their specific needs. A/B testing different messages, timings, and incentives can also help you figure out what resonates most with your audience.
But conversion is only part of the story. To truly understand the financial impact of your app, you need to look at ARPU and LTV.
Average Revenue Per User (ARPU) and Lifetime Value (LTV)
ARPU is calculated as Total Revenue divided by Total Users, while LTV estimates the total revenue a user generates over their lifetime. The formula for LTV is: Average Purchase Value × Purchase Frequency × Customer Lifespan.
For instance, if an Australian app earns $10,000 AUD from 1,000 users in a month, the ARPU is $10 AUD. If those users stay engaged for 12 months, their LTV would be $120 AUD.
The balance between LTV and acquisition costs is vital for profitability. Industry experts suggest aiming for a 3:1 LTV to Cost Per Acquisition (CPA) ratio, meaning each user should generate three times their acquisition cost. Ratios below 1:1 signal unprofitable campaigns, while ratios above 5:1 might indicate room to scale up. Retention also plays a key role here, as repeat customers typically spend 67% more than new ones.
"Blacklane, a chauffeur service, implemented personalised lifecycle campaigns using real-time segmentation to maximise LTV. Their cross-channel strategy resulted in a 194% improvement in lifecycle conversion and a 94% increase in CRM revenue."
To enhance ARPU and LTV, consider:
- Using push notifications and in-app messages to reduce churn.
- Segmenting users by acquisition channel to identify high-value sources.
- Leveraging owned channels like email and SMS to drive repeat purchases through upselling and cross-selling.
How to Track and Analyse Mobile Ad KPIs
Tracking and analysing KPIs requires bringing together data from multiple platforms and turning it into actionable insights. Mobile ad data often comes from sources like Google, Meta, TikTok, and Apple's SKAdNetwork, each with its own quirks - such as varying conversion windows. Without a unified strategy, figuring out which campaigns are genuinely profitable can feel like guesswork. Below, we’ll dive into how benchmarks, tools, and expert partnerships can improve your KPI tracking efforts.
Using Benchmark Tables for KPI Comparison
Before you can optimise your campaigns, you need a clear idea of what good performance looks like. Benchmark tables help you compare your results to both global and Australian standards. For instance, the average Google Ads click-through rate (CTR) is 6.11%, but it can jump to 11.78% in Arts & Entertainment or hover around 6.18% for Finance & Insurance industries. Similarly, cost-per-click (CPC) varies significantly - from about $1.55 AUD for Real Estate to $9.21 AUD for Legal Services.
Here’s a snapshot of Australian benchmarks for mobile advertisers:
| Platform | Avg. CTR | Avg. CPC (AUD) | Key Consideration |
|---|---|---|---|
| Google Ads | 6.11% | $4.22 | High-intent search traffic; varies by industry |
| Facebook Ads | 0.90% | $0.44 | Lower CTR but strong ROI via social engagement |
| Bing Ads | Higher than Google | $1.54 | Typically 44% cheaper than Google Ads |
| TikTok | 6%–14% | Varies | High engagement, ideal for Gen Z targeting |
To get meaningful insights, slice these benchmarks by industry and geography. For example, if you’re running ads for an Australian eCommerce app, comparing your $2.50 AUD cost-per-install (CPI) to a global average won’t cut it. Providers like AppsFlyer and EMARKETER offer localised benchmarks for app installs, CPI, and retention rates.
Tracking and Analysing with Tools and Frameworks
Once benchmarks are set, you’ll need the right tools to track and analyse performance. Mobile Measurement Partners (MMPs) like AppsFlyer act as impartial referees, linking campaign engagements to installs and post-install actions across multiple channels. With a universal SDK, they streamline the process by managing thousands of ad networks through a single integration, saving time and effort.
"An MMP acts as a trusted and impartial referee to rule on attribution." – AppsFlyer
For iOS campaigns, it’s essential to balance Apple's SKAdNetwork (SKAN), which offers aggregated data over 30 days, with Google's conversion modelling, which provides real-time insights. Google also advises consolidating iOS app campaigns to eight or fewer for better performance under SKAN’s framework.
Data integration platforms like Adverity (rated 4.5/5) and Adriel make it easier to unify data from platforms like Google, Meta, and TikTok into cohesive dashboards, offering real-time insights.
Key tracking tips:
- Set realistic bidding targets: For Google App campaigns, aim for an average daily budget at least 50 times your target CPI or 10 times your target CPA.
- Account for conversion delays: Allow campaigns to gather enough data before making significant changes (avoid adjusting budgets or bids by more than 20% in the early days).
- Adjust CPI calculations: Include View-Through Conversions (VTC) to get a clearer picture of ad effectiveness.
- Use proxy events: If your main goal, like purchases, has low volume, track related actions like add-to-cart events for additional data.
Focus on KPIs that directly impact your bottom line, such as growth, retention, and profitability. As Vladimir Ceric, Senior Marketing Manager at Adverity, explains:
"If your CPA is greater than your LTV, you're most likely paying too much to acquire customers."
These tools not only simplify data tracking but also prepare you for smarter decision-making, as discussed in the next section.
Working with Uncommon Insights

For Australian FMCG and eCommerce businesses, teaming up with a growth consultancy can provide clarity. Uncommon Insights, for example, specialises in building tailored KPI strategies and growth roadmaps for companies earning between $1 million and $10 million AUD annually.
Their Marketing Campaign Analysis Framework aligns KPIs with your unique business goals, whether you’re aiming to improve retention, lower customer acquisition costs (CAC), or scale profitably. Instead of relying on generic benchmarks, they create a customised plan that considers your industry, customer lifecycle, and acquisition channels. Their services include growth audits, unit economics analysis, and incrementality testing, paired with AI-powered outputs and weekly updates.
For businesses navigating challenges like balancing lifetime value (LTV) against acquisition costs or dealing with iOS measurement complexities, working with experts like Uncommon Insights can turn uncertainty into actionable knowledge.
Conclusion
Tracking mobile ad KPIs turns uncertainty into actionable insights. As AdAction aptly states, "If you don't measure it, you can't improve it. These essential KPIs will provide you with valuable insight around engagement, UX, and revenue generation." This guide has outlined how key metrics - like cost-per-install and first-week drop-off rates - directly tie to business outcomes, giving you the tools to make informed decisions.
Australia's digital advertising market is set to hit US$20.74 billion by 2025, offering enormous potential. But focusing on vanity metrics, like impressions, won't cut it. To succeed, your KPIs must align with strategic goals. For instance, keeping your Customer Acquisition Cost below your Lifetime Value or ensuring a crash-free session rate above 99.8% are critical benchmarks to aim for.
For FMCG and eCommerce businesses generating between $1 million and $10 million AUD annually, the challenge lies in managing multi-platform tracking, navigating privacy rules like SKAdNetwork, and mastering conversion modelling. Generic benchmarks often fall short, as they fail to account for industry-specific needs, customer lifecycles, or regional differences across cities like Sydney, Melbourne, and Brisbane. Tailored strategies that address these nuances are essential for achieving meaningful results.
The best-performing businesses know how to turn data into action. Take Chefs' Warehouse, for example, which increased online sales by 166% through geo-targeted restructuring, or Flower Merchants, which reduced CPA by 7% while boosting sales by 47%. These successes highlight the power of using KPIs as diagnostic tools to refine and optimise strategies.
A robust mobile ad strategy integrates insights across acquisition, engagement, retention, and monetisation. Start with your North Star Metric and expand by tracking technical stability, user behaviour, and revenue trends. With the right tools, frameworks, and partnerships, you can shift mobile ad performance from guesswork to consistent, measurable growth.
FAQs
What are the best ways to reduce my mobile ad Cost Per Install (CPI)?
To bring down your Cost Per Install (CPI) and improve your campaign's performance, focus on these three core strategies:
- Sharpen your audience targeting: Focus on the users who are most likely to engage with your app. This approach cuts down on unnecessary ad spend and boosts your conversion rates.
- Create engaging ad content: Use eye-catching visuals and clear, persuasive messaging that speaks directly to your audience. Experiment with different ad formats to find what works best.
- Optimise your bidding strategy: Strike a balance between cost and performance. Automated bidding tools can help you manage this efficiently and get the most out of your budget.
Regularly fine-tuning these elements can help you achieve a lower CPI while keeping your campaign results strong.
How can I improve my app's retention rate after 30 days?
Boosting user retention beyond the first 30 days requires a shift in focus from simply acquiring users to keeping them engaged over the long haul. The key lies in understanding your audience's behaviour through metrics like cohort-based retention, churn rates, session lengths, and push notification opt-in rates. These data points help identify patterns and moments where users are likely to drop off.
To win back disengaged users, personalised strategies can make all the difference. Consider implementing timely push notifications, in-app messages offering rewards for continued use, or even a refreshed onboarding experience that reintroduces the app's value. For Australian app teams, here are some tailored approaches to consider:
- Automate cohort analysis to zero in on the 30-day drop-off point and compare it with earlier trends to uncover actionable insights.
- Experiment with post-install messaging, such as welcome flows or tutorial tips, to determine what content resonates most with users and keeps them coming back.
- Launch incentive-driven campaigns, like offering discounts or loyalty points, triggered after specific periods of inactivity (e.g., 7–14 days).
By keeping a close eye on these metrics and continuously fine-tuning your strategies, you can push your retention rates far beyond the industry average of 7%.
How can I ensure my customer Lifetime Value (LTV) outweighs acquisition costs for sustainable growth?
To grow your business sustainably, aim for a Lifetime Value (LTV) that's at least three times greater than your Customer Acquisition Cost (CAC). In other words, your LTV ÷ CAC ratio should consistently be 3 or higher.
To achieve this, focus on strategies that increase customer retention and spending. This could include enhancing the user experience, offering tailored promotions, or rolling out loyalty programs. At the same time, work on refining your customer acquisition efforts to keep costs manageable without sacrificing quality. Striking this balance is key to building a business that thrives over the long term.
Related Blog Posts
Top Metrics for Subscription Platforms
Subscription Analytics: Metrics That Matter Most
How To Align Metrics For Influencer And Affiliate Campaigns
Customer Acquisition Strategy Guide
How to Map DTC Customer Touchpoints
eCommerce Unit Economics: A Complete Analysis Guide
Newsletter
The Uncommon Insights Letter
Practical FMCG & eCommerce growth playbooks — margins, retention and scaling tactics, straight to your inbox.
Turn these ideas into profit you can see
Get a hands-on operator to turn the frameworks above into results — book a free audit call.