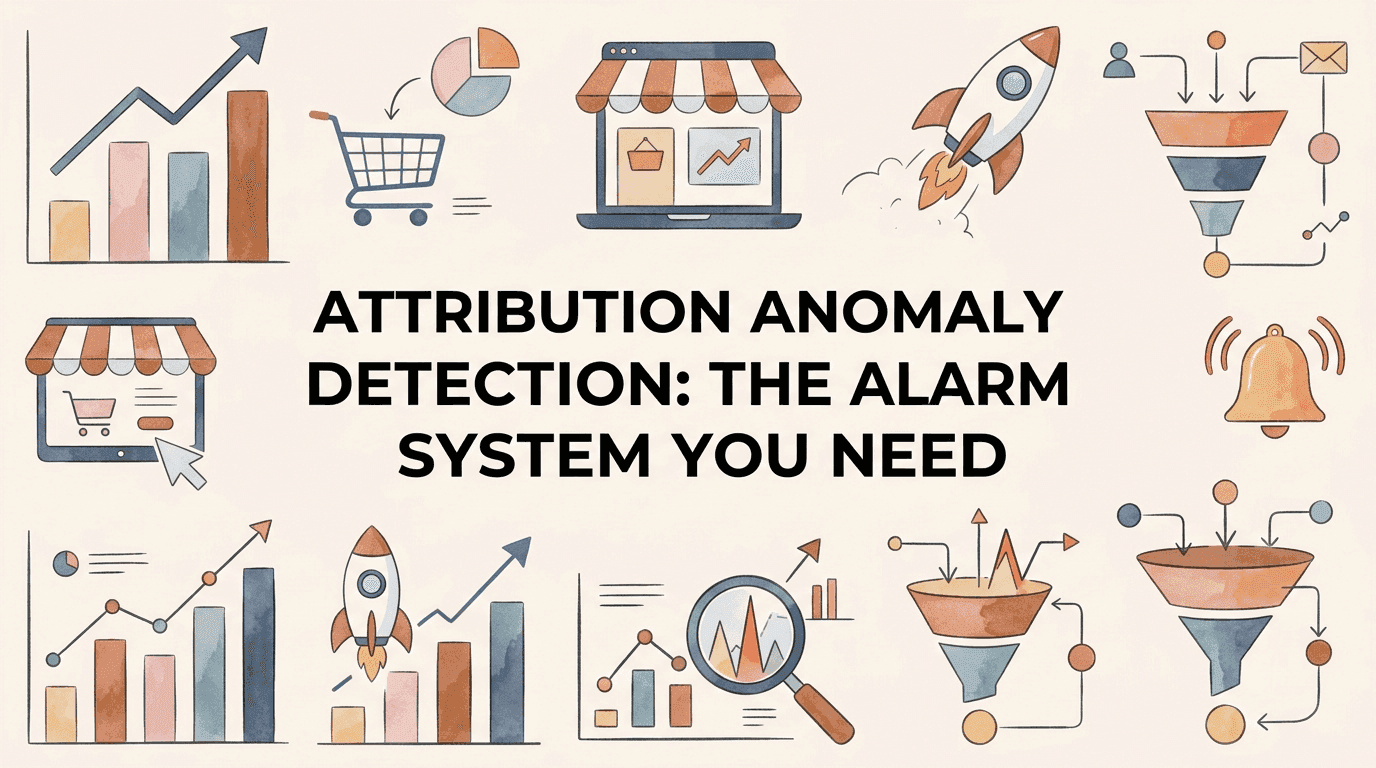
Attribution Anomaly Detection: The Alarm System You Need
A Sydney homewares brand I worked with last quarter scaled their Meta creative budget from $4,000 a week to $9,000 a week over a three-week stretch. Every dashboard told them the bet was working. Meta reported a 4.2 ROAS.
12 min read · 21 April 2026
Attribution Anomaly Detection: The Alarm System You Need
A Sydney homewares brand I worked with last quarter scaled their Meta creative budget from $4,000 a week to $9,000 a week over a three-week stretch. Every dashboard told them the bet was working. Meta reported a 4.2 ROAS. The Shopify revenue line told a different story: flat. A pixel had been over-firing by roughly 8% for nineteen days. They had burned almost $40,000 chasing a number that did not exist.
That is the cost of treating attribution data as a thing you glance at on Monday mornings.
The Three-Week Bleed: Why Weekly Eyeball Reviews Miss Slow Drifts
Most ecommerce operators audit their attribution dashboards the same way they did in 2019. A marketing manager opens GA4, opens Meta Ads Manager, scans the headline numbers, sees nothing obviously broken, and closes the tab. If a CPA suddenly doubles, they will catch it. If a channel goes silent for a day, they will catch it. The problem is that catastrophic failures account for a tiny fraction of the real damage. The expensive failures are the slow ones.
A pixel that starts double-firing on a single browser version. A UTM template that loses its utm_source parameter after a Klaviyo flow update. A consent banner that quietly increases its opt-out rate by 12% after an iOS release. None of these trip an alarm. They drift the baseline. By the time anyone notices, you have made three weeks of budget decisions on numbers that were already wrong.
The economic case for catching this kind of drift is enormous. Comprehensive Meta ads anomaly detection through automated platforms typically drives 15-25% improvements in ROAS, and the bulk of that gain comes from preventing waste rather than improving good traffic. Slow drifts are the exact failure mode that weekly eyeball cadences cannot surface in time. A pixel firing 8% too high for nineteen days does not look like an emergency on day one or day fourteen. It looks like normal performance variance. The only thing that catches it early is a statistical baseline.
The deeper issue is process. Brands that spend $20,000 to $200,000 a month on paid media still treat measurement quality as something the marketing team eyeballs in their spare time. A finance team would never accept "I checked the bank statement and nothing looked weird" as a reconciliation method. A warehouse team would never accept eyeballed stock counts. Yet the marketing function runs on dashboard glances and gut feel, and then the same operators wonder why they are scaling against ghost numbers.
There is a second cost layer that nobody tracks. When attribution data drifts, every downstream decision drifts with it. Creative teams green-light winners that were never winners. Media buyers shift budget toward channels that are over-credited. Forecasts built on inflated CPA assumptions miss for a quarter. The waste is not just the ad spend, it is the strategic time spent acting on bad data. Three-way attribution approaches that compare first-touch, last-touch, and self-attributed signals have become the cross-check that most operators skip, and it is the skipping that costs them.
The standard objection is that small teams do not have the bandwidth to build a detection system. That is a misunderstanding of what is required. The minimum viable version runs in a Google Sheet with conditional formatting. It needs no engineer, no vendor contract, and no data scientist. What it needs is a process owner who is willing to spend two hours a week looking at distributions instead of headline numbers.
The Attribution Alarm System
I call this The Attribution Alarm System. It is a three-layer detection stack designed for $1M to $10M physical product brands that cannot afford a full data engineering function and cannot afford to keep burning $40,000 chasing pixel ghosts. I have deployed this stack across more than a dozen DTC and FMCG brands in the last eighteen months, and the consistent finding is the same: every brand had at least one slow drift running for longer than two weeks before installation, and most had two or three.
The stack has three layers, and they map directly to the way the failure happens.
The first layer is baseline construction. You cannot detect an anomaly without first defining what normal looks like. For each channel, you need a 60 to 90 day window of CPA, conversion rate, and channel contribution percentage, smoothed with both a 7-day and a 28-day rolling average. The 7-day reading catches recent shifts. The 28-day reading anchors the comparison so you do not chase noise. This is the same approach Fairing applied when they rebuilt their post-purchase survey detection after realising eyeballing daily attribution counts was missing genuine drift.
The second layer is threshold wiring. A baseline alone does not alert you to anything. You need rules that translate statistical deviation into a budget action. Two-sigma z-score on CPA. Contribution drift greater than 15% over a 14-day window. Conversion rate delta exceeding 20% versus the trailing 14-day baseline. Each rule is paired with a budget consequence: pause, throttle, investigate. Z-score and rolling-average methods written for analysts give you the simplest statistical baseline a small team can build in a spreadsheet without any prior stats training.
The third layer is response workflow. A detection system that flags an anomaly but has no owner, no SLA, and no documentation is just a noisier version of the dashboard glance. Every alert type needs a named human, a first-check SLA of under four hours, and a one-page post-mortem template. Without this layer, your alarms become noise that the team learns to ignore inside a month.
The framework looks simple because it is simple. The point is not statistical sophistication. The point is that the system runs every day, on every channel, without human attention, and only escalates when something has actually drifted. That is the difference between operators who scale on real numbers and operators who scale on flattering ones.
Phase 1: Baseline Construction (Days 1-21)
Phase 1 is the part most teams want to skip. It is also the part that determines whether the rest of The Attribution Alarm System will work. Without a clean baseline, your thresholds in Phase 2 will fire constantly or never fire at all.
Week 1 is data collection. Pull 60 to 90 days of historical performance for every paid channel: Meta, Google, TikTok, Pinterest, plus organic search, email, and direct. For each channel you need three series at the daily grain: cost per acquisition, conversion rate, and contribution percentage to total revenue. For organic and email channels where there is no spend, drop CPA and use sessions and revenue per session instead. Export to a Google Sheet or a small DuckDB file. Do not skip channels because they are small. Small channels are where slow drifts hide longest because nobody checks them.
Week 2 is smoothing. For each series, compute a 7-day trailing average and a 28-day trailing average. The 28-day average is your baseline. The 7-day average is your current state. The gap between the two is the signal. Plot them as overlapping line charts so the eye can spot divergence. This is also the moment to flag known anomalies in the historical window: a Black Friday spike, a stockout that crashed conversion rate, a creative test that collapsed CPA for a week. Annotate them so you do not later treat normal events as alarms.
Week 3 is distribution mapping. For each channel and each metric, calculate the standard deviation across the 60-day window. This number tells you what natural variance looks like. A channel with a CPA standard deviation of $4 is a stable channel. A channel with a CPA standard deviation of $19 is a noisy channel, and your thresholds need to be wider for it. The same logic applies to conversion rate and contribution percentage. Machine learning baselines built from 30 to 90 days of historical performance work the same way under the hood, and you can build the manual version in a spreadsheet in an afternoon.
Tooling for Phase 1 is deliberately minimal. A Google Sheet with AVERAGE, STDEV, and conditional formatting will run the entire layer for a brand under $5M in revenue. Brands above that threshold should consider a cheap warehouse like BigQuery or Snowflake to hold the raw data, with a dbt model computing the rolling averages. Either way, the operator running this lives inside the marketing team. Engineering involvement is not required and often slows the build.
The single most common mistake in Phase 1 is starting with too short a window. Thirty days is not enough. You will treat normal weekly seasonality as drift and your thresholds will fire every Tuesday. Sixty days is the minimum. Ninety is better if your business has weekly or monthly cycles.
Phase 2: Threshold Wiring (Days 22-45)
Phase 1 gives you a baseline. Phase 2 turns that baseline into a system that actually fires when something breaks. This is where most spreadsheet-based attempts fall apart, because operators set thresholds based on intuition rather than distribution math, and either get flooded with false positives or miss the real drift.
Start with three core rules.
Rule one: CPA two-sigma alert. For each channel, an alert fires when the 7-day rolling CPA exceeds the 28-day baseline by more than two standard deviations. Two-sigma corresponds roughly to the worst 2.5% of normal variance, which is the right sensitivity for a paid media channel that you check daily. If you set it tighter at one-sigma you will get noise. If you set it looser at three-sigma you will miss real drift. The math is in your spreadsheet already. You computed the standard deviation in week 3 of Phase 1.
Rule two: contribution drift alert. For each channel, an alert fires when its share of total revenue moves by more than 15% in either direction over a 14-day window. A channel that suddenly contributes 32% of revenue when it has been steady at 24% is either having a genuinely good moment or it is over-counting. Either case warrants investigation. This rule is the cross-check that catches pixel over-firing and tracking double-counts that CPA alone will not surface, because the channel can look lean on its own metrics while inflating the total.
Rule three: conversion rate delta alert. For each channel, an alert fires when the 7-day CVR differs from the 14-day baseline by more than 20%. A 20% delta on a channel that converts at 2.4% means a swing of about half a percentage point. That is well outside normal daily variance for any meaningfully scaled channel and almost always points to a tracking failure, a landing page break, or a checkout regression. Adverity's operator framing for anomaly detection treats this kind of pattern deviation as the campaign safety net, and it is exactly the failure mode weekly review misses.
Each rule needs a budget action attached. Pause is the strongest action and should only attach to the most severe rule, typically a CVR collapse paired with a CPA spike. Throttle (cut budget by 30% pending investigation) attaches to a single-rule violation that has persisted more than 24 hours. Investigate (no budget action, but a same-day human review) attaches to a single-rule violation in its first day. The rules without consequences are just noise, and noise gets ignored.
Wiring is mechanical. In a spreadsheet, conditional formatting plus an IF formula gives you a coloured cell. A simple IFTTT or Zapier connection can pipe coloured cells to a Slack channel. Brands above $5M should consider data-engineering-grade quality detection tools, which apply the same logic at warehouse scale and can monitor 30 channels without a human owner per channel. The principle does not change with scale. The plumbing does.
Phase 3: The Alert-Investigate-Fix Workflow (Day 46+)
A detection system without a response workflow is worse than no system at all, because it produces alerts that train the team to ignore alerts. Phase 3 is the operating discipline that keeps the alarm stack useful past month two.
Every alert type gets a named owner. CPA spike on Meta is owned by the Meta media buyer. Contribution drift on email is owned by the lifecycle marketer. CVR collapse on the site is owned by the head of ecommerce. The owner does not have to fix the problem alone. They have to be the single accountable person whose phone buzzes and who runs the first investigation step.
Every alert type gets a first-check SLA of under four hours during business hours. Four hours is the cutoff because below it the team treats every alert as urgent and burns out. Above it the alert loses its value, because by the time someone looks the spend has already moved. Four hours forces a same-day response without making the system feel like a pager rotation.
Every investigation produces a one-page post-mortem. Five fields: what alert fired, what investigation showed, what was the root cause, what was the fix, what guardrail prevents recurrence. Five fields, one page, ten minutes to fill out. Brands that skip this step end up debugging the same broken UTM three times in a quarter. The post-mortems become the institutional memory of how attribution actually breaks at your business, and after six months you have a playbook that lets a new hire diagnose 80% of alerts without escalation.
The investigation tree itself follows a predictable order. For a CPA spike, start with creative fatigue, then audience saturation, then platform pricing, then tracking. For a CVR collapse, start with site speed, then checkout regressions, then tracking, then traffic mix shift. For a contribution drift, start with tracking double-count, then a campaign launch on another channel, then a real channel shift. Aimerce's diagnostic tree for CPA spikes maps cleanly onto this kind of investigate-fix workflow and is a useful starting template.
Cadence matters. Run a 30-minute weekly review where the team looks at the last seven days of alerts, the post-mortems, and the false-positive rate. False positives above 25% mean your thresholds are too tight, retune them. False positives below 5% mean they may be too loose, watch for missed drifts. Once a quarter, recompute the baseline from the last 60 to 90 days. Markets shift, channels shift, your normal shifts with them. A baseline you set in January will be wrong by April if you do not refresh it.
The discipline that holds this together is documentation, not technology. The brands that get The Attribution Alarm System right are the ones whose marketing leads write down every alert and every fix. The brands that fail are the ones who leave the system running but stop investigating, because once the team learns that nobody reads the alerts, the alerts are dead.
The New Discipline: Treating Attribution Data as a Living System
Attribution data is not a report you read on Mondays. It is a live operational signal that decays, drifts, and breaks the same way inventory counts and bank reconciliations do, and it deserves the same kind of operating discipline. The Attribution Alarm System is the operating discipline.
The metric that matters going forward is not your headline ROAS or your blended CAC. It is your time-to-detect. How many hours pass between an attribution failure starting and a human noticing it. Brands running on weekly eyeball cadences typically run a time-to-detect of 7 to 21 days. Brands with a baseline-and-threshold system in place typically run under 12 hours. The 15 to 25% ROAS that used to leak into broken tracking does not get recovered with better targeting or sharper creative. It gets recovered by catching the drift before the spend follows it.
Three months from now, your team should be able to point at any alert in the last 90 days and tell you which channel fired, what the root cause was, what the fix cost, and what guardrail now prevents recurrence. If they cannot, the system has not landed yet. If they can, you have rebuilt the foundation that every other attribution decision in the business sits on.
The next move is to build the spreadsheet this week. Pull 60 days of channel data on Tuesday. Compute rolling averages and standard deviations on Wednesday. Wire the three threshold rules on Thursday. Name the owners and write the post-mortem template on Friday. By Monday next week, you have something the weekly eyeball review never gave you: a system that watches the data so you do not have to.
Breakeven ROAS Calculator
The exact ad return you need to break even — and the one you need to actually profit.
The Real-Time Attribution Monitoring Playbook for DTC
Why Cross-Channel Attribution Challenges Break Your Budget
A Complete Facebook Pixel Optimization Guide for Physical Brands
Analytics Reporting Stack Setup: Decisions Over Dashboards
Audience Attribution Insights: Mapping Segments to Revenue
Social Media on Shopify: A Catalog Sync and CAPI Guide
Newsletter
The Uncommon Insights Letter
Practical FMCG & eCommerce growth playbooks — margins, retention and scaling tactics, straight to your inbox.
Turn marketing attribution into profit you can see
Get a hands-on operator to turn the frameworks above into results — book a free audit call.