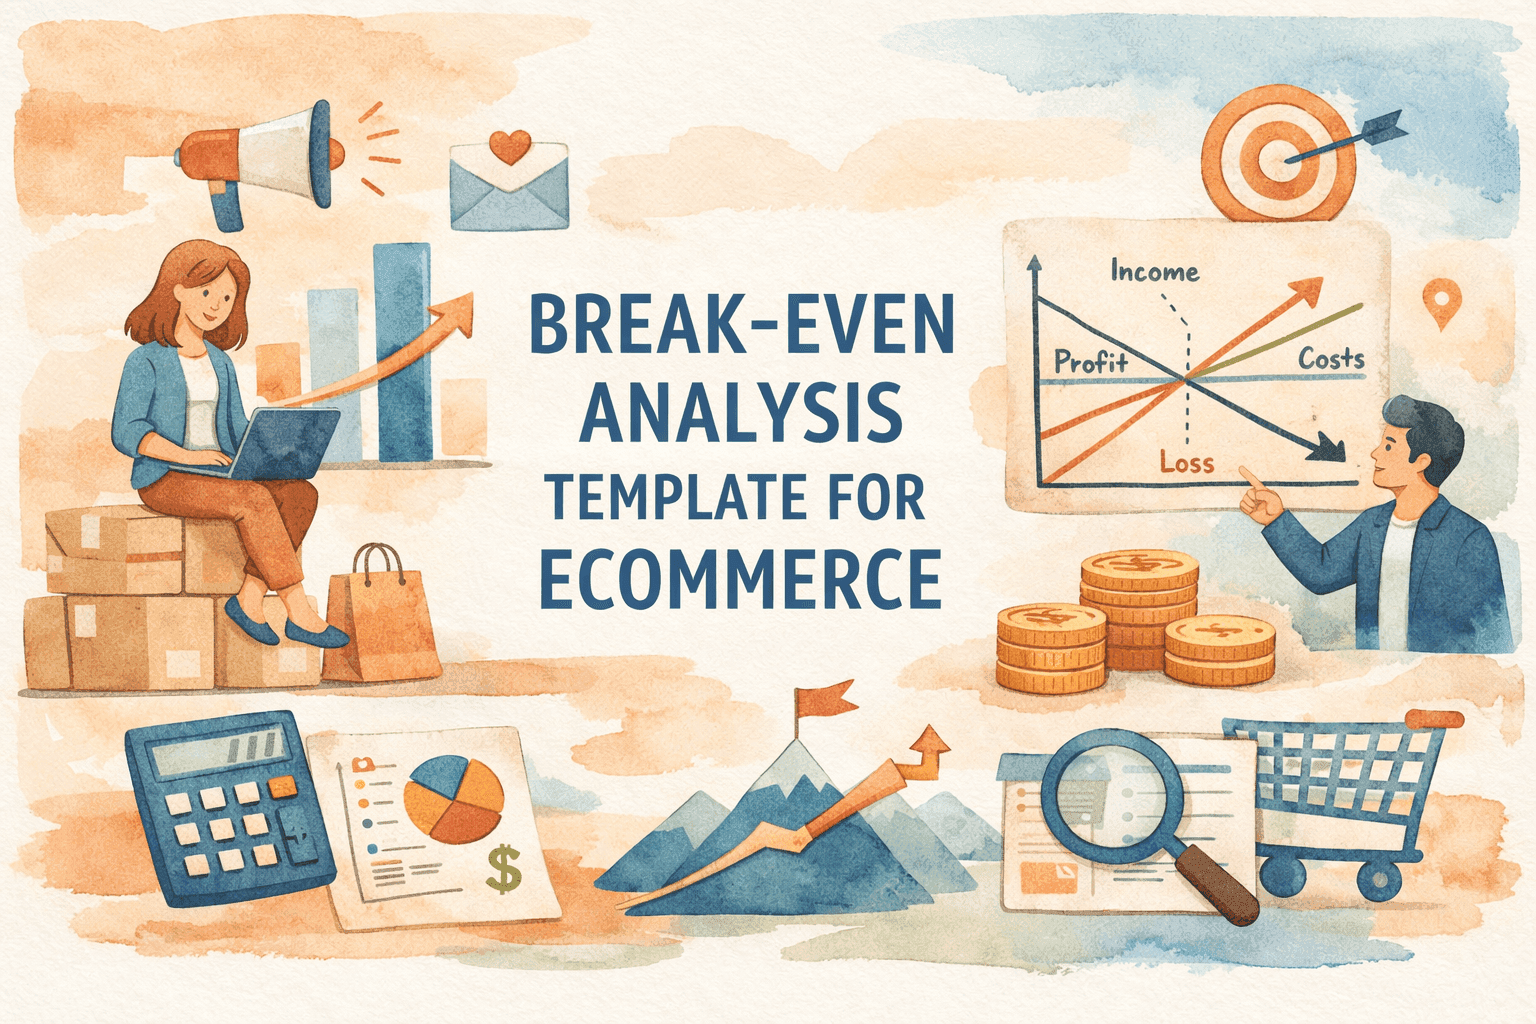
Break-Even Analysis Template for Ecommerce
Calculate your break-even point to understand when your ecommerce business becomes profitable. Template with formulas, examples, and Australian benchmarks.
9 min read · 17 March 2026
- The Profitability Question Nobody Answers Until It's Too Late
- What Break-Even Analysis Actually Tells You
- The Break-Even Clarity Framework
- Understanding Fixed and Variable Costs
- The Break-Even Analysis Template
- Break-Even Scenarios: Worked Examples
- Multi-Product Break-Even Analysis
- Sensitivity Analysis: Testing Your Assumptions
The Profitability Question Nobody Answers Until It's Too Late
Most ecommerce businesses launch without knowing their break-even point. They set prices based on competitor analysis, order inventory based on optimism, and hope the numbers work out. Then they wonder why profitability remains elusive despite growing revenue.
About 80% of ecommerce businesses fail despite the massive opportunity on the internet. A significant portion of these failures trace back to a fundamental problem: operators never calculated what it would actually take to break even, let alone profit.
Break-even analysis isn't an academic exercise for business school. It's the foundational calculation that determines whether your business model is viable-whether the prices you charge, the costs you carry, and the volume you can achieve will ever combine to produce profit.
Without this knowledge, you're not running a business. You're gambling with extra steps.
What Break-Even Analysis Actually Tells You
Break-even analysis is an accounting process for determining at what point a company, or a new product or service, will be profitable. It's a financial calculation used to determine the number of products or services you must sell to at least cover your production costs.
The break-even point is where total revenue equals total costs-no profit, no loss. Everything sold beyond that point generates profit. Everything sold below it generates loss.
What Break-Even Analysis Reveals:
1. Viability confirmation: Whether your business model can ever be profitable at current pricing and costs 2. Volume requirements: Exactly how many units you need to sell to cover costs 3. Pricing guidance: Whether your prices are sufficient given your cost structure 4. Risk assessment: How sensitive your profitability is to cost or volume changes 5. Investment planning: How long before your capital investment starts generating returns
For ecommerce specifically, break-even analysis forces you to confront the real economics of selling physical products-including all the hidden costs that erode margins.
The Break-Even Clarity Framework
Break-even analysis isn't complicated, but most operators overcomplicate it-or skip it entirely. The Break-Even Clarity Framework provides a systematic approach to calculating and monitoring your profitability threshold.
My view is that break-even is the single most important number most ecommerce operators don't know. They track revenue, orders, conversion rates-everything except the point at which they stop losing money. This template forces that calculation and, more importantly, builds break-even monitoring into ongoing operations.
The core break-even formula is elegantly simple:
Units to Break Even:
> Break-Even Point (units) = Fixed Costs ÷ (Price per Unit - Variable Cost per Unit)
The denominator (Price - Variable Cost) is called the contribution margin-how much each sale contributes toward covering fixed costs and generating profit.
Revenue to Break Even:
> Break-Even Point (revenue) = Fixed Costs ÷ Contribution Margin Ratio
Where: > Contribution Margin Ratio = (Price - Variable Cost) ÷ Price
Example Calculation:
An Australian fashion accessories brand:
- Fixed Costs: $8,500/month (rent, software, salaries, insurance)
- Average Selling Price: $65
- Variable Cost per Unit: $28 (product cost, shipping, packaging, processing)
Contribution Margin = $65 - $28 = $37 Break-Even Units = $8,500 ÷ $37 = 230 units/month
Contribution Margin Ratio = $37 ÷ $65 = 56.9% Break-Even Revenue = $8,500 ÷ 0.569 = $14,938/month
This business must sell 230 units generating $14,938 in revenue to break even. Every unit beyond that generates $37 in profit.
Understanding Fixed and Variable Costs
To understand break-even analysis, you must know the difference between costs-specifically fixed and variable. Getting this classification wrong invalidates your entire analysis.
Fixed Costs (Don't Change with Sales Volume)
Fixed costs remain constant regardless of how much you sell. They're the cost of being in business.
Common Ecommerce Fixed Costs:
| Category | Examples | Typical Monthly Range |
|---|---|---|
| Platform & Software | Shopify, apps, email marketing, analytics | $200-$1,500 |
| Warehousing | Storage rent, utilities | $500-$5,000 |
| Labour (Fixed) | Salaries, contractor retainers | $2,000-$20,000 |
| Insurance | Product liability, business insurance | $100-$500 |
| Accounting/Legal | Bookkeeper, compliance | $300-$1,000 |
| Marketing (Fixed) | Brand assets, content production | $500-$3,000 |
Total Fixed Costs Example: $5,000-$15,000/month for a typical growing ecommerce business.
Variable Costs (Change with Sales Volume)
Variable costs increase or decrease directly with sales volume. More sales = more variable costs.
Common Ecommerce Variable Costs:
| Category | Calculation | Typical % of Sale |
|---|---|---|
| Product Cost (COGS) | Wholesale or manufacturing cost | 30-50% |
| Shipping (Outbound) | Carrier rates, packaging | 8-15% |
| Payment Processing | Credit card fees | 2.5-3.5% |
| Returns Processing | Return rate × cost per return | 2-8% |
| Pick & Pack | Fulfilment labour per order | 2-5% |
| Marketing (Variable) | Ad spend per sale | 15-30% |
Variable Cost Per Unit Example:
A $75 product might have:
- Product cost: $25 (33%)
- Shipping: $8 (11%)
- Processing: $2.50 (3%)
- Returns allowance: $3 (4%)
- Pick/pack: $2 (3%)
- Total Variable: $40.50 (54%)
- Contribution Margin: $34.50 (46%)
The Break-Even Analysis Template
Step 1: Calculate Fixed Costs
List all monthly fixed costs:
| Fixed Cost | Monthly Amount |
|---|---|
| Ecommerce platform | $_____ |
| Apps & software | $_____ |
| Warehousing/storage | $_____ |
| Salaries & wages | $_____ |
| Insurance | $_____ |
| Accounting | $_____ |
| Marketing (fixed) | $_____ |
| Other fixed costs | $_____ |
| Total Fixed Costs | $_____ |
Step 2: Calculate Variable Costs per Unit
For your average or primary product:
| Variable Cost | Amount per Unit |
|---|---|
| Product cost (COGS) | $_____ |
| Outbound shipping | $_____ |
| Packaging | $_____ |
| Payment processing | $_____ |
| Returns allowance | $_____ |
| Pick & pack | $_____ |
| Marketing (per unit) | $_____ |
| Total Variable Cost | $_____ |
Step 3: Calculate Contribution Margin
| Metric | Calculation | Your Value |
|---|---|---|
| Average Selling Price | $_____ | |
| Total Variable Cost per Unit | $_____ | |
| Contribution Margin ($) | Price - Variable Cost | $_____ |
| Contribution Margin (%) | CM ÷ Price | _____% |
Step 4: Calculate Break-Even Point
| Metric | Formula | Your Value |
|---|---|---|
| Break-Even Units | Fixed Costs ÷ CM ($) | _____ units |
| Break-Even Revenue | Fixed Costs ÷ CM (%) | $_____ |
| Break-Even Units (Daily) | BE Units ÷ 30 | _____ units/day |
Step 5: Assess Achievability
| Question | Your Answer |
|---|---|
| Are you currently selling above break-even volume? | Yes / No |
| If no, how far below? | _____ units |
| Is break-even volume achievable with current marketing? | Yes / No |
| What would it take to reach break-even? | _________ |
Break-Even Scenarios: Worked Examples
Scenario 1: Low Fixed Cost / High Margin
Dropship supplement brand:
- Fixed Costs: $3,000/month
- Selling Price: $55
- Variable Cost: $22
- Contribution Margin: $33 (60%)
Break-Even = $3,000 ÷ $33 = 91 units/month (3 per day)
Assessment: Highly achievable. Low overhead and strong margins create a forgiving break-even point.
Scenario 2: Moderate Fixed Cost / Moderate Margin
Fashion accessories brand:
- Fixed Costs: $12,000/month
- Selling Price: $85
- Variable Cost: $45
- Contribution Margin: $40 (47%)
Break-Even = $12,000 ÷ $40 = 300 units/month (10 per day)
Assessment: Achievable with consistent marketing. Requires reliable traffic and conversion.
Scenario 3: High Fixed Cost / Low Margin
Furniture brand with warehouse:
- Fixed Costs: $35,000/month
- Selling Price: $450
- Variable Cost: $310
- Contribution Margin: $140 (31%)
Break-Even = $35,000 ÷ $140 = 250 units/month (8 per day)
Assessment: Challenging. High-ticket sales require significant marketing investment and long sales cycles.
Scenario 4: Problem Structure
Electronics accessories:
- Fixed Costs: $8,000/month
- Selling Price: $35
- Variable Cost: $28
- Contribution Margin: $7 (20%)
Break-Even = $8,000 ÷ $7 = 1,143 units/month (38 per day)
Assessment: Problematic. Razor-thin margins require massive volume. Small cost increases or price pressure could make break-even impossible.
Multi-Product Break-Even Analysis
Most ecommerce businesses sell multiple products with different margins. Calculating break-even requires either weighted averages or individual product analysis.
Weighted Average Approach:
| Product | Revenue Mix | Contribution Margin | Weighted CM |
|---|---|---|---|
| Product A | 50% | 45% | 22.5% |
| Product B | 30% | 38% | 11.4% |
| Product C | 20% | 52% | 10.4% |
| Blended | 100% | 44.3% |
Break-Even Revenue = Fixed Costs ÷ Blended Contribution Margin Break-Even = $10,000 ÷ 0.443 = $22,573/month
Product-Level Analysis:
Alternatively, calculate break-even for each product assuming it carries all fixed costs:
| Product | Fixed Cost Share | CM | Break-Even Units |
|---|---|---|---|
| Product A | $5,000 | $30 | 167 units |
| Product B | $3,000 | $25 | 120 units |
| Product C | $2,000 | $40 | 50 units |
This reveals that Product C reaches break-even fastest-useful for prioritising marketing investment.
Sensitivity Analysis: Testing Your Assumptions
Break-even analysis uses assumptions that may prove wrong. Sensitivity analysis tests how changes affect your break-even point.
Price Sensitivity:
What happens if you need to discount 10%?
| Scenario | Price | Variable Cost | CM | Break-Even |
|---|---|---|---|---|
| Current | $75 | $35 | $40 | 250 units |
| 10% Discount | $67.50 | $35 | $32.50 | 308 units |
| 20% Discount | $60 | $35 | $25 | 400 units |
A 10% discount increases break-even volume by 23%. A 20% discount increases it by 60%.
Cost Sensitivity:
What if shipping costs increase 20%?
| Scenario | Price | Variable Cost | CM | Break-Even |
|---|---|---|---|---|
| Current | $75 | $35 | $40 | 250 units |
| +20% Shipping | $75 | $37 | $38 | 263 units |
| +40% Shipping | $75 | $39 | $36 | 278 units |
Shipping cost increases have more modest effects than price decreases.
Volume Sensitivity:
What if you can only achieve 80% of target volume?
| Target Volume | Achievement | Actual Units | Profit/(Loss) |
|---|---|---|---|
| 300 units | 100% | 300 | $2,000 profit |
| 300 units | 80% | 240 | ($400 loss) |
| 300 units | 60% | 180 | ($2,800 loss) |
Missing volume targets by 20% swings from profit to loss.
Using Break-Even Analysis for Pricing Decisions
Break-even analysis helps determine product pricing more accurately. Work backward from target volume to required pricing.
Price-Volume Trade-off:
If you can sell 200 units at $80 or 300 units at $65, which is better?
| Scenario | Units | Price | Variable Cost | Revenue | Contribution |
|---|---|---|---|---|---|
| High Price | 200 | $80 | $35 | $16,000 | $9,000 |
| Low Price | 300 | $65 | $35 | $19,500 | $9,000 |
Same contribution, but the high-price scenario requires fewer sales, less inventory, and less customer service.
Minimum Viable Price:
What's the lowest price you can charge and still break even at achievable volume?
> Minimum Price = Variable Cost + (Fixed Costs ÷ Achievable Volume)
If fixed costs are $10,000, variable cost is $30, and maximum achievable volume is 400 units:
Minimum Price = $30 + ($10,000 ÷ 400) = $55
Any price below $55 guarantees loss at maximum volume.
The 30-Day Break-Even Sprint
Week 1: Data Collection
- List all fixed costs (review last 3 months of expenses)
- Calculate average selling price (revenue ÷ orders)
- Determine variable costs per unit (product, shipping, processing)
- Calculate current monthly volume
Week 2: Analysis
- Calculate contribution margin
- Calculate break-even point
- Compare to current volume
- Identify gap (if any)
Week 3: Sensitivity Testing
- Model price change scenarios
- Model cost change scenarios
- Identify highest-risk variables
- Determine margin of safety
Week 4: Action Planning
- If below break-even: identify specific changes to reach it
- If at break-even: identify changes to create margin of safety
- If above break-even: calculate profit optimisation opportunities
- Set monitoring cadence (monthly review)
Break-Even Monitoring Dashboard
Monthly Metrics
| Metric | Current | Target | Variance |
|---|---|---|---|
| Fixed Costs | $_____ | $_____ | _____% |
| Variable Cost per Unit | $_____ | $_____ | _____% |
| Average Selling Price | $_____ | $_____ | _____% |
| Contribution Margin | _____% | _____% | _____ pts |
| Break-Even Units | _____ | _____ | _____% |
| Actual Units Sold | _____ | _____ | _____% |
| Margin of Safety | _____% | >25% | _____% |
Margin of Safety Calculation
The margin of safety measures how far above break-even you're operating:
> Margin of Safety = (Actual Sales - Break-Even Sales) ÷ Actual Sales
A 25% margin of safety means sales could drop 25% before you hit break-even. Higher is better.
The New North Star Metric: Contribution Efficiency Ratio
Stop obsessing over break-even units alone. Track your Contribution Efficiency Ratio (CER)-the percentage of revenue above break-even that converts to actual profit after all variable costs.
The Calculation:
CER = (Revenue - Break-Even Revenue) × Contribution Margin % / Fixed CostsInterpretation:
- CER > 1.5: Strong profit conversion-each dollar above break-even generates significant margin
- CER 1.0-1.5: Adequate efficiency-scaling creates profit but slowly
- CER < 1.0: Inefficient structure-growth generates less profit than expected
This metric reveals how effectively your business converts growth into profit. High break-even with high CER can outperform low break-even with low CER.
The Break-Even Foundation
By understanding your break-even point, you can see how costs affect profitability, helping you make smarter choices from day one.
Break-even analysis isn't something you do once and forget. It's a living calculation that should inform every pricing decision, cost negotiation, and growth plan.
Know your number. Monitor your number. Beat your number.
Your profitability depends on it.
Unit Economics Calculator
Contribution margin per order after COGS, shipping and fees — the number scaling actually depends on.
Break-Even Analysis Calculator [Tool]
Product Profitability Analysis Template
Contribution Margin Calculator by Product [Tool]
The Leverage Trap: Why Scale Doesn't Automatically Mean Profit
Unit Economics Checklist: Contribution Margin
Checklist: Fixed vs Variable Costs for Startups
Newsletter
The Uncommon Insights Letter
Practical FMCG & eCommerce growth playbooks — margins, retention and scaling tactics, straight to your inbox.
Turn unit economics into profit you can see
Get a hands-on operator to turn the frameworks above into results — book a free audit call.