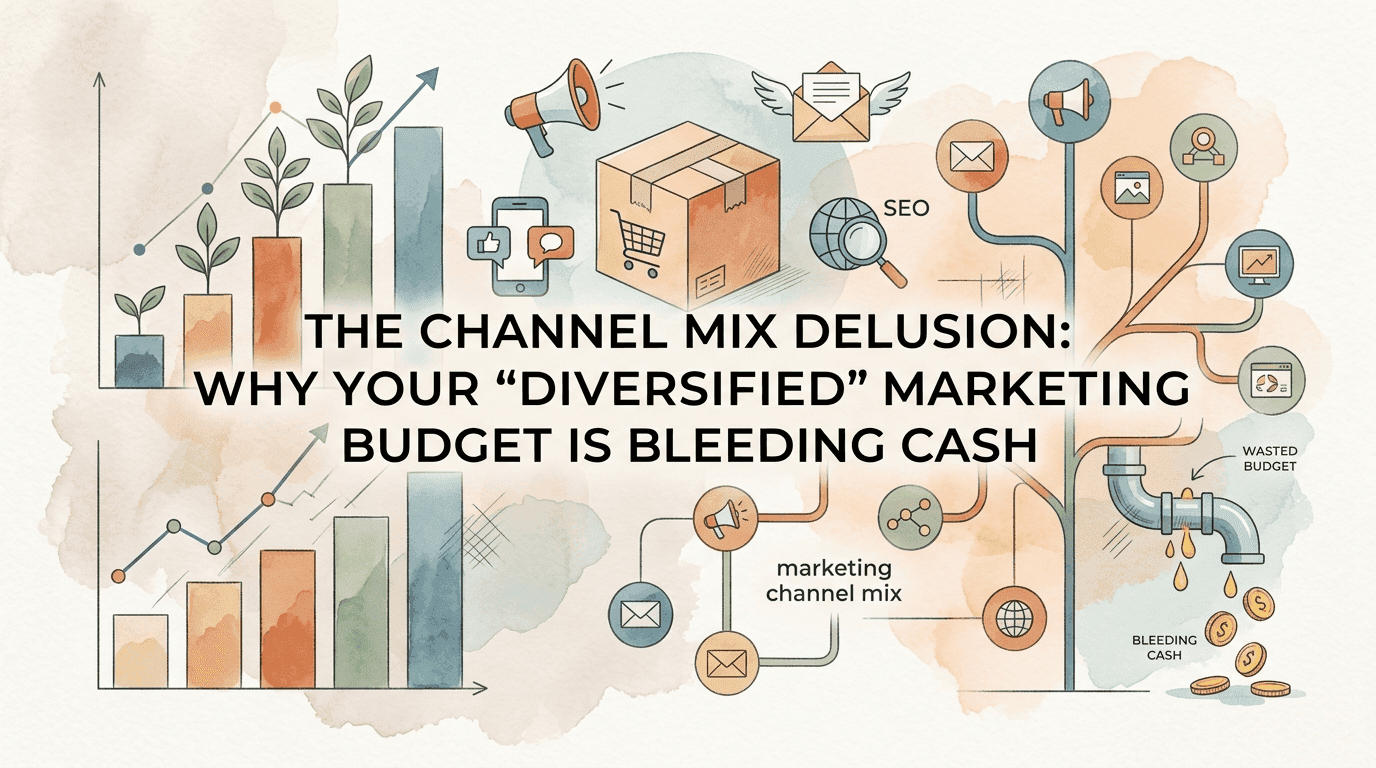
The Channel Mix Delusion: Why Your "Diversified" Marketing Budget Is Bleeding Cash
There's a comfortable fiction circulating through ecommerce boardrooms: spreading marketing budget across multiple channels equals safety. Diversification protects you from platform risk. A balanced approach hedges your bets.
10 min read · 23 July 2025
The Channel Mix Delusion: Why Your "Diversified" Marketing Budget Is Bleeding Cash
There's a comfortable fiction circulating through ecommerce boardrooms: spreading marketing budget across multiple channels equals safety. Diversification protects you from platform risk. A balanced approach hedges your bets.
This thinking will cost you a fortune.
The reality? Most "diversified" channel mixes aren't strategic at all—they're the accumulated residue of years of opportunistic experimentation, legacy decisions nobody questions, and budget allocations that persist simply because they existed last year. The typical ecommerce business isn't running an optimised channel mix. They're running marketing archaeology.
Here's what the data reveals: ecommerce brands using Marketing Mix Modeling increased revenue by 2.9% without increasing total spend. That's found money—millions for larger brands—simply from redistributing existing budget toward what actually works. And yet most businesses never perform this analysis.
The problem isn't ignorance. It's that proper channel optimisation requires uncomfortable truths: some channels you've defended for years contribute nothing. Others you've neglected deserve significant investment. The sunk cost of previous decisions makes objectivity nearly impossible without forcing the numbers.
The Hidden Economics of Channel Performance
Let's start with what most marketers get wrong: comparing channels by platform-reported ROAS.
Your Facebook Ads manager shows 5:1 ROAS. Your Google Ads shows 4:1. TikTok claims 3:1. Easy decision—put more into Facebook, right?
Wrong. These numbers are nearly meaningless for allocation decisions.
Every platform uses self-serving attribution. They each claim credit for the same conversions. The customer who saw your TikTok ad, later Googled your brand, and finally converted from an email gets counted as a conversion by TikTok, Google, and your email platform. Your aggregate "attributed" revenue across platforms routinely exceeds actual revenue by 40-100%.
True channel economics require incremental measurement—understanding what revenue each channel generates that wouldn't have occurred otherwise. This is harder to calculate but infinitely more useful.
Consider the channel ROI research from First Page Sage, which analysed results across multiple industries over five years. When properly measured using hybrid attribution models, ROI varies dramatically—with some channels delivering 10x or more the returns of others. Yet most businesses allocate budget based on "feel" or last year's split rather than these fundamental economics.
What Each Channel Actually Delivers
Based on aggregated industry data from 2024-2025, here's what proper measurement reveals about true channel ROI for ecommerce:
Email Marketing: The uncontested champion. Email generates $36-40 per dollar—a 3,600% to 4,000% ROI. For retail and ecommerce specifically, the returns climb even higher to 4,500%. About 44% of marketers rate email as their most effective channel, with social media and paid search tied at distant second place with only 16% each.
Yet here's the absurdity: the average email marketing budget is only 7.8% of total marketing spend. Businesses are systematically under-investing in their highest-performing channel.
Organic Search (SEO): Long-term economics that compound over time. SEO delivers roughly 5:1 ROI for ecommerce when measured properly, and 49% of businesses report it brings their best marketing ROI of any channel. The catch: results take 6-12 months to materialise, making it unsuitable for businesses needing immediate returns.
Paid Search (Google Ads): The workhorse that delivers predictable but moderate returns. Google estimates $8 per dollar in profit from Google Ads—an 800% ROI. However, this includes brand search, where customers would likely have converted anyway. True incremental ROI on prospecting campaigns is lower.
Paid Social (Meta, TikTok): The most over-hyped and under-measured category. Recent data shows Facebook's average ad ROI has declined significantly—one analysis found it dropped from $4 per $1 spent to around $1.75 in recent years. Direct-response ecommerce campaigns can still achieve 3:1 or 4:1 ROAS, but the gap between platform-reported and true incremental value is widest here.
Influencer Marketing: Surprisingly strong when executed well. Businesses earn approximately $6.50 for every $1 spent on influencer campaigns on average. The top performers see returns of $20+ per dollar.
The Budget Allocation Problem
Marketing budgets have fallen to 7.7% of revenue between 2020 and 2024—a significant compression. The 2024 Gartner survey confirms this 15% year-over-year drop, from 9.1% to 7.7%.
With shrinking budgets and expanding channel options, allocation efficiency matters more than ever. Yet most businesses still allocate based on:
- Historical precedent ("We've always spent 40% on paid social")
- Vendor pressure ("Your Meta rep says you're under-spending")
- Competitive mimicry ("Competitors seem to be on TikTok")
- FOMO ("AI ads are the future, we need to be there")
None of these are valid allocation strategies. They're excuses dressed up as strategy.
The Channel Efficiency Matrix: A Framework for Reallocation
Proper channel optimisation requires understanding three dimensions simultaneously: ROI efficiency, time-to-return, and scalability. A channel can excel on one dimension while failing on others.
I call this the Channel Efficiency Matrix, and it forces explicit tradeoffs that most marketing teams avoid.
Dimension 1: ROI Efficiency
Raw return per dollar invested. Based on industry benchmarks:
| Channel | Typical ROI | Efficiency Tier |
|---|---|---|
| Email Marketing | 36:1 - 45:1 | Elite |
| Organic Search (SEO) | 5:1 - 8:1 | High |
| Paid Search (Google) | 2:1 - 4:1 | Medium |
| Influencer Marketing | 3:1 - 7:1 | Medium-High |
| Paid Social | 1.5:1 - 3:1 | Low-Medium |
What this reveals: Email should receive dramatically more allocation than it typically does. Paid social should receive scrutiny—if your returns are below 2:1 and you're spending 30%+ of budget there, something is broken.
Dimension 2: Time to Return
How quickly each channel generates measurable revenue:
Immediate (Days): Paid search, paid social, email campaigns to existing subscribers
Short-Term (Weeks): Influencer campaigns, affiliate marketing
Medium-Term (Months): Content marketing, social organic
Long-Term (6-12+ Months): SEO, brand-building activities
What this reveals: Businesses needing quick returns should weight toward paid channels and email, despite potentially lower long-term ROI. Businesses with runway should invest more heavily in compounding channels like SEO.
Dimension 3: Scalability Ceiling
How much you can invest before diminishing returns become severe:
High Scalability: Paid search (limited by search volume), paid social (wide audience)
Medium Scalability: Influencer marketing, affiliate programs
Low Scalability: Email (limited by list size), organic channels
What this reveals: Email may have the best ROI, but you can only scale it as fast as your list grows. High-scalability channels are necessary for aggressive growth even if efficiency is lower.
Using the Matrix
Plot your current channels across all three dimensions. You'll likely discover:
- Over-invested, under-performing channels — high spend with low efficiency and no strategic scalability rationale
- Under-invested, high-performing channels — usually email and SEO
- Strategic gaps — missing channels that could address specific dimensions you're weak on
The goal isn't maximising any single dimension. It's assembling a portfolio that matches your business situation across all three.
The 60-Day Channel Audit and Reallocation Sprint
Here's your tactical playbook for optimising your channel mix:
Week 1-2: True Performance Extraction
Objective: Calculate actual channel performance, not platform vanity metrics.
- Export 12 months of spend by channel
- Export actual revenue by date (not attributed—actual deposit/settlement data)
- Pull platform-reported conversions for each channel
- Calculate conversion inflation: (Total platform-reported revenue / Actual revenue)
- Apply inflation discount to each channel's claimed performance
For example, if platforms collectively claim $2.4M in attributed revenue but you actually generated $1.5M, your inflation factor is 1.6x. A channel claiming 4:1 ROAS is actually delivering closer to 2.5:1.
Deliverable: Adjusted channel performance spreadsheet with inflation-corrected metrics.
Week 3-4: Incremental Impact Analysis
Objective: Understand which channels drive truly incremental revenue.
Run holdout tests if possible:
- Pause paid social in one geographic region for 2-4 weeks
- Compare revenue decline to control markets
- Calculate true incremental impact
If holdout tests aren't feasible, use correlation analysis:
- Identify periods where specific channels were paused or significantly scaled
- Analyse revenue patterns during those periods
- Estimate directional incrementality
Key questions to answer:
- What percentage of branded search traffic would convert anyway?
- How much paid social is capturing demand vs. generating it?
- Which channels show revenue decline when paused vs. no impact?
Deliverable: Incrementality estimate for each major channel.
Week 5-6: Efficiency Optimisation Modeling
Objective: Build your reallocation recommendation.
Using your adjusted performance data and incrementality estimates:
- Rank channels by true ROI (not platform-reported)
- Identify channels with largest gap between current allocation and efficiency-based allocation
- Model scenarios: What happens if you shift 20% of budget from lowest performer to highest?
- Account for scalability constraints (can the high-performer actually absorb more spend profitably?)
- Build a phased reallocation plan
Deliverable: Recommended allocation model with scenario projections.
Week 7-8: Implementation and Measurement Framework
Objective: Execute reallocation with proper measurement in place.
- Implement budget changes gradually (20% shift in Week 7, additional 20% in Week 8)
- Set up proper tracking to isolate reallocation impact from seasonality
- Establish weekly monitoring cadence for first 30 days
- Document baseline metrics before changes for comparison
- Define decision criteria for reverting if performance degrades
Measurement framework:
- Track blended ROAS weekly (total revenue / total marketing spend)
- Monitor channel-specific metrics for early warning signs
- Compare to same-period prior year when possible
- Hold allocation steady for 4-6 weeks before additional changes
The Category-Specific Allocation Starting Point
While every business requires custom analysis, here are research-backed starting allocations for different ecommerce categories:
Fashion and Apparel
High visual discovery, seasonal cycles, significant influencer impact.
Recommended Starting Mix:
- Paid Social: 25-30%
- Email Marketing: 20-25%
- Influencer/Affiliate: 15-20%
- Paid Search: 15-20%
- SEO/Content: 10-15%
- Experimental: 5%
Rationale: Visual platforms drive discovery. Influencers provide social proof. Email captures high repeat purchase opportunity.
Home Goods and Furniture
Longer consideration cycles, higher AOV, strong search intent.
Recommended Starting Mix:
- Paid Search: 25-30%
- SEO/Content: 20-25%
- Email Marketing: 20%
- Paid Social: 15-20%
- Retargeting: 10%
- Experimental: 5%
Rationale: High-intent search captures active shoppers. Long research cycles reward content investment. Email nurtures considered purchases.
Health and Beauty
High repeat purchase, strong community elements, influencer-driven.
Recommended Starting Mix:
- Email Marketing: 25-30%
- Paid Social: 20-25%
- Influencer/Affiliate: 15-20%
- Paid Search: 15%
- SEO/Content: 10%
- Experimental: 5%
Rationale: Subscription and repeat purchase economics favour email heavily. Influencer recommendations drive trial. Community building creates loyalty loops.
Electronics and Tech
High research, comparison shopping, specific feature searches.
Recommended Starting Mix:
- Paid Search: 30-35%
- SEO/Content: 20-25%
- Email Marketing: 15-20%
- Retargeting: 10-15%
- Paid Social: 5-10%
- Experimental: 5%
Rationale: Technical specifications drive search behaviour. Comparison content ranks well. Lower repeat purchase reduces email importance.
The Australian Market Adjustment
Australian ecommerce operators face specific channel dynamics that warrant adjustment to global benchmarks:
Paid Media Costs: Australian CPMs and CPCs run 15-30% higher than US equivalents on major platforms due to smaller audience size and currency effects. This shifts ROI calculations—channels that are marginally profitable in the US may be unprofitable in Australia.
Email Performance: Australian email engagement rates track slightly below US averages, but the ROI advantage remains. With ecommerce email ROI exceeding $45 for some businesses, even at slightly lower engagement, email remains the highest-ROI channel.
Search Volumes: Smaller population means lower overall search volume. SEO scales less effectively, but competition is also lower—ranking is often more achievable.
Social Platform Mix: Australian audiences skew differently on platform preference. Facebook usage remains strong relative to global trends. TikTok penetration is significant in younger demographics but lags US adoption.
Recommendation: Australian businesses should typically allocate 5-10% more toward email (where efficiency is unmatched) and 5-10% less toward paid social (where costs are higher and scale is limited).
From Allocation to Optimisation: The Ongoing Process
Channel optimisation isn't a one-time exercise. Market conditions shift, platform economics change, and your customer behaviour evolves. The businesses that maintain channel efficiency treat this as a continuous process:
Monthly: Review blended efficiency metrics. Flag any channel showing >20% performance shift.
Quarterly: Run mini-audits on largest spend channels. Update incrementality estimates. Adjust allocation 5-10% based on findings.
Annually: Full channel audit with holdout testing. Evaluate emerging channels. Rebuild allocation model from scratch.
About 53.5% of US marketers now use Marketing Mix Modeling to navigate measurement challenges—a significant increase driven by privacy changes that make platform-level attribution less reliable. MMM provides the macro view needed for proper allocation, combining with multi-touch attribution for tactical optimisation.
The North Star: Blended Efficiency
Your ultimate channel metric shouldn't be any single channel's ROAS. It should be blended efficiency: total revenue divided by total marketing spend across all channels.
This metric cuts through platform attribution wars. It doesn't matter if Facebook or Google claims the conversion—what matters is whether your aggregate marketing investment is generating acceptable returns.
Target blended efficiency depends on your unit economics:
- Subscription businesses with high LTV: Can accept 1.5:1 to 2:1 on customer acquisition
- Single-purchase businesses with low repeat: Need 3:1+ to maintain margin
- High-margin products (>60% gross): Can operate at 2:1-3:1
- Low-margin products (<30% gross): Require 4:1+ for profitability
Track blended efficiency weekly. If it's declining while you scale, you've pushed past diminishing returns on key channels. If it's improving, you have room to invest more aggressively.
The Channel Reallocation Decision
The Uncomfortable Reallocation Conversation
Here's the real barrier to channel optimisation: it requires killing sacred cows.
Every marketing team has them. The influencer programme that was someone's pet project. The podcast sponsorship that "builds brand" with no measurable impact. The display retargeting that's been running since 2019 because nobody questioned it.
Optimisation means looking at data objectively and making uncomfortable cuts. It means admitting that last year's allocation was wrong. It means having honest conversations about channels that people have emotional attachment to.
The ecommerce businesses that grow profitably are those that overcome this discomfort. They treat marketing budget as working capital that must earn its return, not as a portfolio of legacy commitments.
Your channel mix is either optimised for performance or optimised for comfort. It can't be both.
Run the audit. Do the math. Reallocate toward what works.
The 2.9% revenue increase from optimised allocation isn't theoretical. It's money currently trapped in underperforming channels, waiting to be reallocated to what actually drives growth.
Unit Economics Calculator
Contribution margin per order after COGS, shipping and fees — the number scaling actually depends on.
Customer Acquisition Cost by Channel Analysis
Why Your Attribution Model Is Burning Marketing Budget
Return on Ad Spend (ROAS) Optimization Framework
Customer Lifetime Value by Acquisition Channel Analysis
Customer acquisition cost by channel analysis
Incrementality Testing Framework for Ecommerce
Newsletter
The Uncommon Insights Letter
Practical FMCG & eCommerce growth playbooks — margins, retention and scaling tactics, straight to your inbox.
Turn unit economics into profit you can see
Get a hands-on operator to turn the frameworks above into results — book a free audit call.