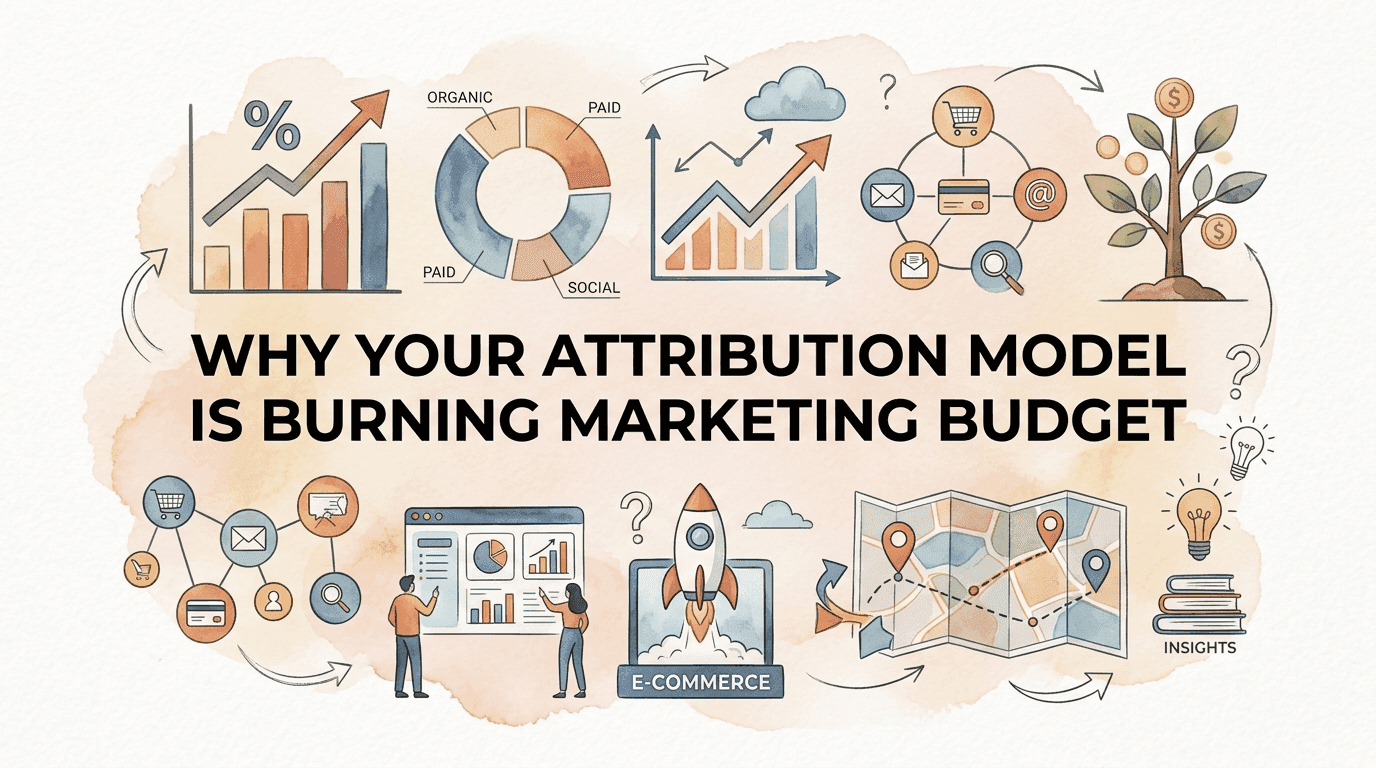
Why Your Attribution Model Is Burning Marketing Budget
Most ecommerce operators are making million-dollar decisions based on a lie.
10 min read · 9 October 2025
Why Your Attribution Model Is Burning Marketing Budget
Most ecommerce operators are making million-dollar decisions based on a lie.
The lie is this: the last thing a customer clicked before buying deserves all the credit for that sale. This "last-click attribution" model remains the default across Google Analytics, most ad platforms, and nearly every ecommerce dashboard. It's convenient. It's simple to explain. And it's systematically destroying your ability to understand what actually drives revenue.
Here's the uncomfortable reality: only 21.5% trust last-click for measuring long-term impact. Yet 78.4% continue using it anyway. That's not measurement—it's institutional self-deception at scale.
For Australian ecommerce businesses spending $30,000 to $300,000 monthly on marketing, this attribution failure doesn't just create fuzzy reports. It actively steers budget toward channels that look good on paper while starving the touchpoints that actually generate demand. The result? Progressively declining returns as you optimise for symptoms rather than causes.
The Last-Click Delusion: What It's Actually Costing You
Imagine this scenario: A potential customer sees your Instagram ad on Monday. She visits your site, browses a few products, leaves. On Wednesday, she receives your email about a new collection, clicks through, adds something to cart, abandons. On Friday, she Googles your brand name directly, finds your site, and completes the purchase.
Under last-click attribution, Google branded search gets 100% credit. Instagram gets nothing. Email gets nothing. Your marketing team celebrates branded search performance and cuts Instagram spend. Three months later, branded search volume mysteriously declines.
This isn't hypothetical. It's happening across thousands of ecommerce businesses every day.
The problem runs deeper than simplified reporting. 74.5% abandoning last-click or planning to—yet many remain trapped by organisational inertia, legacy systems, or simple lack of alternatives. Meanwhile, ad platforms exploit this confusion by each claiming credit for the same conversions.
Research from Fospha reveals the scale of distortion: 41% potential investment for paid social because last-click systematically undervalues upper-funnel activity. When brands can't see impact, they won't invest—leaving significant revenue on the table.
The Platform Credit Grab
Here's where it gets worse. Each advertising platform uses its own version of attribution, often claiming full credit for conversions that other platforms also claim. A single customer journey might generate "conversions" in Meta Ads Manager, Google Ads, TikTok attribution, and GA4—all for one actual purchase.
This creates what attribution specialists call "conversion inflation." Your aggregate ROAS across platforms might look phenomenal at 8:1 or 10:1 when it's actually closer to 3:1. Budget allocation becomes nearly impossible when every platform tells you it's the hero.
For a $100,000 monthly ad spend, even modest attribution errors compound into massive misallocation. If you're over-attributing to branded search by 30% while under-attributing to prospecting by the same margin, you're effectively burning $30,000 monthly on the wrong channels.
The Upper-Funnel Starvation Cycle
Last-click attribution creates a predictable death spiral:
Quarter 1: Upper-funnel channels (social, display, video) generate brand awareness and demand. Last-click gives them no credit. Retargeting and branded search capture the conversions and look brilliant.
Quarter 2: Marketing cuts upper-funnel spend to double down on "what's working." Retargeting and branded search maintain performance initially—they're still capturing demand generated earlier.
Quarter 3: The demand pipeline starts drying up. Retargeting audiences shrink. Branded search volume declines. Performance dips.
Quarter 4: Everyone's confused. "What changed?" Nothing changed except you stopped generating the demand you were harvesting.
This pattern repeats across Australian ecommerce with depressing regularity. Businesses attribute the decline to "market conditions" or "increased competition" when they've actually optimised themselves into a corner.
The Multi-Touch Revenue Intelligence Framework
The solution isn't simply switching from last-click to first-click or even a basic position-based model. These alternatives share the same fundamental flaw: arbitrary credit assignment disconnected from actual customer behaviour.
What works is building a measurement ecosystem that captures the complete customer journey while acknowledging uncertainty. I call this the Multi-Touch Revenue Intelligence Framework.
The framework operates on three principles:
Principle 1: Journey reconstruction over touchpoint isolation. Instead of asking "which channel converted?" ask "what did the entire path to purchase look like?" This requires stitching together touchpoints across sessions, devices, and platforms into unified customer journeys.
Principle 2: Incrementality over attribution. Attribution asks who gets credit. Incrementality asks what would have happened without this touchpoint. The second question is harder to answer but infinitely more useful for budget decisions.
Principle 3: Model triangulation over single-source truth. No single attribution approach captures reality. Sophisticated operators run multiple models simultaneously and look for convergence.
Building Your Attribution Foundation
Before implementing advanced models, most ecommerce businesses need to fix their measurement fundamentals. Based on common attribution challenges in GA4 and cross-platform tracking, here's your baseline checklist:
UTM Discipline: Every marketing link needs consistent, complete UTM parameters. No exceptions. Create a UTM template spreadsheet and enforce it across all team members and agencies. Inconsistent UTMs are the single largest source of attribution data corruption.
First-Party Data Collection: With third-party cookies phasing out and privacy regulations tightening, first-party data is now essential. Implement server-side tracking where possible. Set up enhanced conversions in Google Ads to improve data quality.
Cross-Device Identity: Use authenticated user IDs when available to connect journeys across devices. A customer researching on mobile and purchasing on desktop shouldn't appear as two separate users.
Lookback Window Configuration: GA4 defaults to a 30-day lookback window, which may not match your sales cycle. If customers typically take 45 or 60 days from first touch to purchase, adjust your lookback window accordingly (up to 90 days in GA4).
Consent Mode Implementation: Properly configured consent mode improves modelled data accuracy when users opt out of tracking, helping fill gaps in your attribution data.
The Attribution Model Stack: Practical Implementation
The multi-touch attribution market reflects growing sophistication in how businesses approach measurement. $4.61 billion by 2030, advancing at 13.66% annually—driven by the shift to privacy-first marketing and the need to connect online and offline customer data.
But you don't need enterprise software to implement meaningful attribution improvements. Here's a practical stack for ecommerce businesses at different stages:
Stage 1: Basic Multi-Touch (Sub-$2M Revenue)
At this stage, focus on moving beyond pure last-click without overcomplicating your stack.
Model: Position-based (40-20-40) or linear attribution in GA4.
Implementation: Enable data-driven attribution in GA4 if you have sufficient conversion volume (at least 300 conversions and 3,000 ad interactions in the past 30 days). Otherwise, use position-based as your default view while maintaining last-click for comparison.
Key Actions:
- Set up UTM tracking across all channels
- Create custom reports comparing last-click vs. position-based attribution
- Document touchpoint patterns for your highest-value customers
- Build a basic customer journey dashboard
Monthly Review Cadence: Compare channel credit shifts between models. If a channel consistently performs better under position-based than last-click, it's likely being undervalued in your current allocation.
Stage 2: Triangulated Measurement ($2M-$10M Revenue)
As marketing spend scales, single-model attribution becomes increasingly unreliable. Triangulation involves running multiple measurement approaches and looking for convergence.
Models in Use:
- GA4 data-driven attribution (algorithmic, based on your conversion data)
- Platform-specific attribution (Meta, Google, TikTok—each with their own models)
- Media mix modelling (MMM) or incrementality testing
Implementation:
Deploy a dedicated attribution tool (options include Northbeam, Triple Whale, Rockerbox, or Ruler Analytics) alongside GA4. These tools specialise in cross-channel attribution for ecommerce, providing person-level data and additional insights like brand awareness impact.
Run incrementality tests quarterly on major channels. This means turning channels off in specific markets or audiences to measure true incremental impact. Yes, this costs money. Yes, it's worth it.
Key Actions:
- Compare attribution tool output against GA4 data-driven attribution
- Run holdout tests on at least one major channel per quarter
- Build a cross-model comparison dashboard
- Document where models agree and disagree
15-30% efficiency gains from multi-channel attribution when properly implemented. That's the prize for getting this right.
Stage 3: Full Revenue Intelligence ($10M+ Revenue)
At scale, attribution becomes a data science function, not a marketing operations task.
Components:
- Real-time multi-touch attribution platform with customer data platform (CDP) integration
- Ongoing incrementality testing program across all major channels
- Marketing mix modelling refreshed quarterly with econometric analysis
- Server-side tracking infrastructure for privacy-compliant measurement
Team Requirements:
- Dedicated marketing analyst or data scientist
- Attribution tool administrator
- Clear ownership of data quality
Investment: Expect to allocate 2-5% of marketing budget to measurement infrastructure at this stage. This isn't overhead—it's insurance against misallocation of the other 95-98%.
Execution: The 60-Day Attribution Upgrade
Here's your tactical playbook for implementing better attribution measurement:
Week 1-2: Audit and Baseline
Objective: Understand your current attribution reality.
- Export last 90 days of conversions from GA4, segmented by source/medium
- Pull the same data from all advertising platforms
- Calculate total claimed conversions across platforms vs. actual conversions
- Document the gap (expect 40-100% inflation)
- Identify your five highest-spend channels
- Map current UTM taxonomy and document inconsistencies
Deliverable: Attribution audit document showing conversion inflation percentage and UTM coverage gaps.
Week 3-4: Foundation Fixes
Objective: Establish clean measurement infrastructure.
- Create standardised UTM template with naming conventions
- Implement UTM governance process (no links go live without approved UTMs)
- Configure GA4 lookback window appropriately for your sales cycle
- Set up enhanced conversions in Google Ads
- Review consent mode implementation
- Enable data-driven attribution in GA4 if eligible
Deliverable: UTM governance document and updated GA4 configuration.
Week 5-6: Model Comparison
Objective: Understand how attribution models change your view of performance.
- Build a comparison dashboard showing channel performance under:
- Last-click attribution
- Position-based attribution
- Data-driven attribution (if available)
- Identify channels with largest credit shifts between models
- Analyse top 100 customer journeys manually to understand typical paths
- Document multi-touch journey patterns
Deliverable: Model comparison dashboard and journey pattern analysis.
Week 7-8: Decision Framework
Objective: Create actionable budget allocation process.
- Develop channel performance scorecard incorporating multiple attribution models
- Weight models based on your confidence in each (e.g., 50% DDA, 30% position-based, 20% last-click as a sanity check)
- Build scenario models for budget reallocation
- Create incrementality testing calendar for the next quarter
- Establish monthly attribution review cadence
Deliverable: Weighted attribution scorecard and testing calendar.
The North Star: Marginal Contribution to Revenue
Here's the metric that should ultimately guide your marketing decisions: marginal contribution to revenue by channel.
This asks a simple question: if I spend one additional dollar on this channel, how much additional revenue will it generate?
The answer requires moving beyond attribution toward incrementality. Attribution tells you what happened. Incrementality tells you what would have happened differently.
Calculating marginal contribution requires:
- Baseline establishment: What's your organic demand without any paid marketing?
- Channel isolation: What happens to revenue when you turn specific channels on or off?
- Diminishing returns curves: At what spend level does each channel's efficiency decline?
For most ecommerce businesses, this reveals uncomfortable truths. Branded search, which looks brilliant under last-click, often has marginal contribution close to zero—those customers would have found you anyway. Upper-funnel channels, which look terrible under last-click, frequently drive the majority of incremental revenue.
Building these curves takes time. Start with simple holdout tests: pause a channel in specific geographic markets and measure the total revenue impact (not just attributed conversions). Compare to control markets. Scale up or down based on what you learn.
Attribution Metrics That Actually Matter
Beyond marginal contribution, these metrics should populate your attribution dashboard:
Time to Conversion by Channel: How long do customers take from first touch to purchase, segmented by initial channel? Upper-funnel channels naturally have longer time-to-conversion but may have higher ultimate value.
Assisted Conversion Ratio: For each channel, what's the ratio of assisted conversions (appeared in path but didn't get last-click credit) to last-click conversions? Ratios above 1.0 indicate undervaluation under last-click.
New Customer Attribution: Which channels drive first-time purchasers vs. repeat customers? Branded search might convert existing customers efficiently while failing to generate net new demand.
Path Length by Value: Do your highest-value customers have longer, more complex paths to purchase? If so, you need multi-touch measurement to understand what's actually driving your best outcomes.
Cross-Device Journey Percentage: What portion of conversions involve multiple devices? High percentages indicate last-click is particularly unreliable (crediting the final device when purchase intent was generated elsewhere).
The Attribution Reality
From Attribution Theater to Revenue Intelligence
Most ecommerce businesses practice what I call "attribution theater"—they have dashboards, they track conversions, they discuss ROAS in meetings—but they're not actually using attribution data to make better decisions. The dashboards exist for reporting, not for steering.
Genuine revenue intelligence means:
- You know your conversion inflation percentage (how much platforms collectively over-claim)
- You've tested incrementality on at least your top three channels
- Budget decisions incorporate multiple models rather than defaulting to last-click
- You have documented journey patterns for your highest-value customer segments
- Attribution review happens monthly with documented action items
52% use multi-touch attribution, with 57% planning to increase usage. 75% using multi-touch models to measure performance. The question isn't whether to adopt better attribution—it's how quickly you can implement it before competitors optimise past you.
The $2.43 billion multi-touch attribution market isn't growing at 13.66% annually because vendors are good at marketing. It's growing because ecommerce operators who implement proper measurement consistently outperform those who don't. 15-30% lower acquisition costs from advanced attribution and up to 40% improvement in marketing ROI compared to last-click—that's the performance gap you're leaving on the table.
Start with the 60-day playbook above. Fix your UTMs. Configure your lookback windows. Run your first model comparison. Then graduate to incrementality testing and triangulated measurement.
Your marketing budget is too important to allocate based on a model that even its users don't trust. Build measurement infrastructure worthy of your investment, and you'll find revenue where your competitors see only confusion.
Unit Economics Calculator
Contribution margin per order after COGS, shipping and fees — the number scaling actually depends on.
Marketing Attribution Analysis: Why Your Channel Data Is Lying to You (And What to Build Instead)
The Attribution Decay Problem: Why Your Last-Click Model Shows 40% Higher ROAS Than Reality
How Conversion Path Analysis Exposes Your Hidden Revenue
The Channel Mix Delusion: Why Your "Diversified" Marketing Budget Is Bleeding Cash
Why Shopify's AI Traffic Growth Breaks Traditional Attribution Models (And How to Fix Your CAC Calculation)
Privacy Compliant Attribution Methods That Actually Work
Newsletter
The Uncommon Insights Letter
Practical FMCG & eCommerce growth playbooks — margins, retention and scaling tactics, straight to your inbox.
Turn unit economics into profit you can see
Get a hands-on operator to turn the frameworks above into results — book a free audit call.