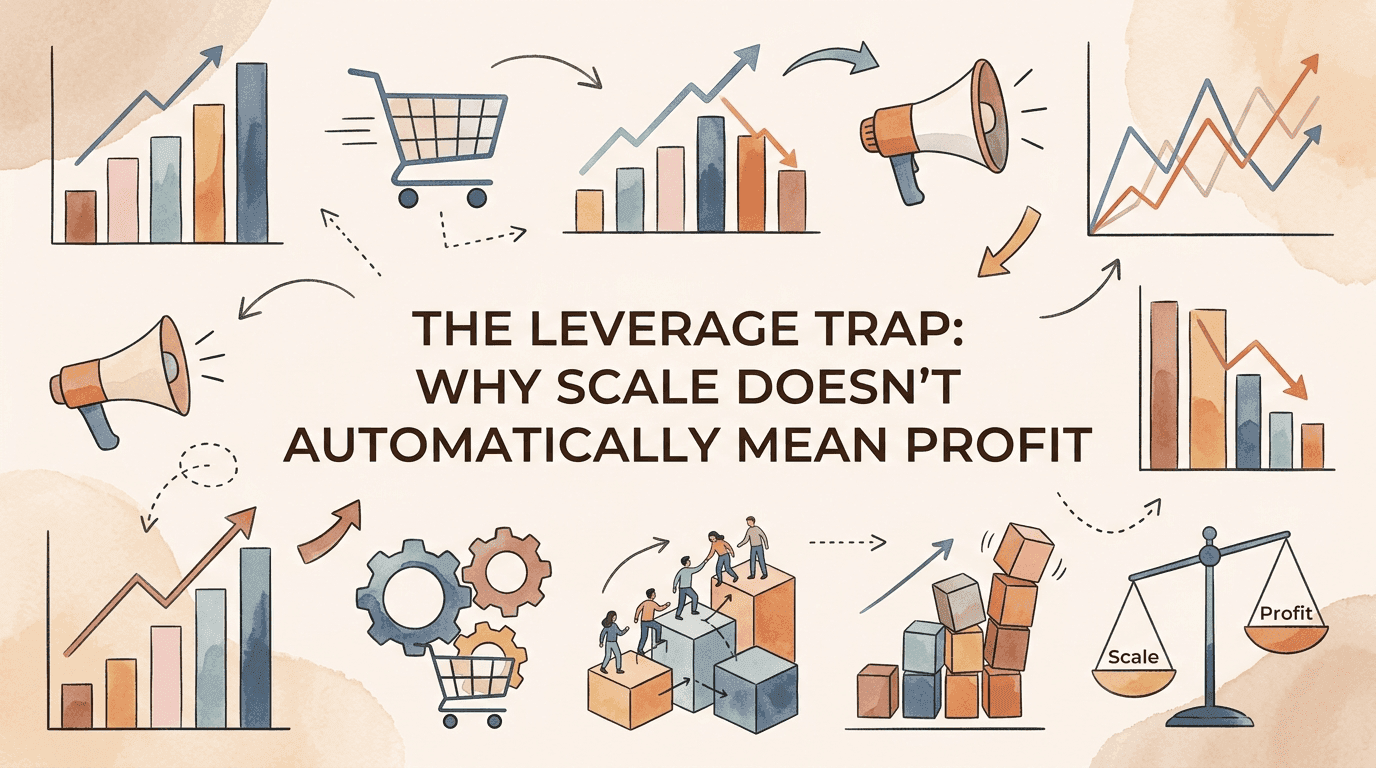
The Leverage Trap: Why Scale Doesn't Automatically Mean Profit
Every ecommerce founder has heard the promise: scale brings profitability. Get big enough, and your costs will spread across more units. Margins will expand. The business will print money.
10 min read · 2 January 2026
The Leverage Trap: Why Scale Doesn't Automatically Mean Profit
Every ecommerce founder has heard the promise: scale brings profitability. Get big enough, and your costs will spread across more units. Margins will expand. The business will print money.
It's half true. And the half that's wrong destroys businesses.
The reality is more nuanced: operational leverage—the relationship between your fixed and variable cost structures—determines whether scale makes you rich or drowns you in overhead. Get the mix wrong, and every dollar of growth makes your problem worse, not better.
Here's the uncomfortable math: 30-40% operating cost target, with platform fees capped at 15%. When operating costs exceed 35%, businesses face cash flow challenges that scaling alone won't solve.
For Australian ecommerce operators in the $2M to $5M range, understanding operational leverage isn't optional—it's the difference between building a business that compounds value and running one that simply gets bigger while staying broke.
The Fixed-Variable Cost Architecture
Before discussing leverage, we need clarity on what separates fixed from variable costs. The distinction seems obvious but hides critical nuance that most operators miss.
Variable Costs scale directly with sales volume. When you sell more, these costs increase proportionally. When you sell less, they decrease. They include:
- Cost of goods sold (product cost, landed)
- Payment processing fees (typically 1.5-3%)
- Marketplace commissions and platform fees
- Pick, pack, and ship costs per order
- Variable marketing spend tied to orders acquired
- Return processing costs
Fixed Costs remain constant regardless of sales volume—at least within a relevant range. Sell nothing, and you still pay these. Sell double, and they stay flat. They include:
- Warehouse rent and base utilities
- Salaries for permanent staff
- Software subscriptions (inventory management, accounting, etc.)
- Insurance and compliance costs
- Base marketing spend (brand, not performance)
- Loan servicing and financing costs
The leverage concept comes from physics: a small force applied with leverage creates large output. In business, high operational leverage means a small increase in revenue creates a disproportionately large increase in profit—because fixed costs don't rise with volume.
But leverage cuts both ways. If revenue drops, those fixed costs don't drop with it. High-leverage businesses can swing from profit to loss violently.
The Leverage Calculation
Degree of Operating Leverage (DOL) measures how sensitive your operating profit is to changes in revenue:
DOL = Contribution Margin / Operating Profit
Or expressed differently:
DOL = % Change in Operating Profit / % Change in Revenue
Example: A business with 40% contribution margin and 10% operating profit has DOL of 4x. This means a 10% revenue increase produces a 40% increase in operating profit. But a 10% revenue decline produces a 40% decline in operating profit.
High DOL (3x+): Mostly fixed costs. Big profit swings from revenue changes. Great during growth, devastating during downturns.
Low DOL (1.5x or less): Mostly variable costs. Stable but limited profit expansion from growth.
50% variable cost cap for CAC plus delivery. This benchmark provides a target structure, but the right mix depends on your strategic situation.
The Cost Structure Decision
Your fixed-variable mix isn't an accident—it's a strategic choice with profound implications for risk, growth potential, and operational requirements.
The High-Fixed-Cost Model
Characteristics:
- Own or lease warehouse rather than using 3PL
- Employ in-house fulfillment staff
- Build proprietary technology
- Invest heavily in brand (non-performance marketing)
- Carry high average inventory levels
Advantages:
- Higher profit potential at scale (contribution flows to bottom line)
- Greater operational control
- Competitive moat from operational infrastructure
- Lower per-unit costs at volume
Disadvantages:
- Higher breakeven point (more revenue needed to cover fixed base)
- Less flexibility during downturns
- Capital-intensive growth
- Higher business risk
Best suited for: Businesses with predictable, stable demand; strong balance sheets; long-term competitive advantages to defend.
The High-Variable-Cost Model
Characteristics:
- Use 3PL for fulfillment
- Outsource customer service
- Rely on marketplace platforms
- Focus marketing on performance/direct response
- Operate lean inventory with just-in-time replenishment
Advantages:
- Lower breakeven point
- Flexibility to scale up and down
- Less capital required
- Lower business risk during uncertainty
Disadvantages:
- Limited profit expansion at scale (costs rise with volume)
- Less operational control
- Margin pressure from vendors/platforms
- Harder to build competitive moats
Best suited for: New businesses testing product-market fit; seasonal businesses; companies in uncertain markets; capital-constrained operators.
The Hybrid Reality
Most ecommerce businesses operate somewhere between these extremes. The strategic question is which direction to shift as you grow—and when.
The typical evolution: Start high-variable (use 3PLs, marketplace platforms, outsourced services) to minimise risk while validating the business. As demand becomes predictable and scale increases, gradually shift toward fixed costs where the math favours it.
Key transition points:
- Bringing fulfillment in-house: Typically makes sense at 100-200+ orders per day, where the fixed cost of warehouse and staff is offset by lower per-order costs
- Building internal teams: When outsourced service costs exceed what equivalent in-house team would cost, plus value of control and knowledge retention
- Technology investment: When customisation needs exceed what off-the-shelf solutions provide, and scale justifies development costs
20% vs 8% margins for top performers vs median. The gap between median and top performers often comes down to cost structure optimisation—high-margin businesses have found the right fixed-variable balance for their situation.
The Three-Tier Contribution Margin Framework
To manage operational leverage effectively, you need visibility into how costs layer through your business. The Three-Tier Contribution Margin Framework provides this clarity.
I've seen too many brands obsess over gross margin while ignoring the costs that eat it away before reaching the bottom line. A 60% gross margin sounds healthy until fulfillment, processing, and marketing consume 45 points of it. This framework forces visibility into where contribution actually lands after all variable costs are accounted for.
CM1, CM2, CM3 framework provides layered profitability view by progressively subtracting variable costs from sales revenue.
CM1 (Gross Margin): Revenue minus cost of goods sold. This is traditional gross profit—what remains after direct product costs.
Target: 50-70% depending on category. Below 40% creates severe constraints.
CM2 (Variable Contribution Margin): CM1 minus variable operating costs (fulfillment, payment processing, performance marketing, platform fees).
Target: 25-35% for healthy unit economics.
CM3 (Full Contribution Margin): CM2 minus remaining variable costs (returns processing, customer service costs that scale with orders).
Target: 15-25% to generate profit after fixed costs.
The gap between CM3 and your actual net operating margin represents your fixed cost burden. If CM3 is 20% but net margin is 5%, fixed costs consume 15 percentage points of revenue.
Using the Framework
Scenario 1: CM1 healthy, CM2 weak
Your products have good margin, but variable operating costs are too high. Focus on:
- Negotiating fulfillment rates
- Reducing payment processing costs
- Improving marketing efficiency
Scenario 2: CM2 healthy, CM3 weak
Core operations are efficient, but supporting functions are costly. Focus on:
- Reducing return rates
- Automating customer service
- Improving order quality (fewer issues)
Scenario 3: CM3 healthy, Net margin weak
Unit economics are sound, but fixed overhead is excessive. Focus on:
- Scaling volume to spread fixed costs
- Reducing fixed commitments where possible
- Restructuring toward variable costs until scale justifies fixed
best profitability metric for ecommerce startups as it helps identify the most profitable products, enables effective pricing strategies, and indicates how well the business can cover fixed costs.
The Leverage Transition: A 60-Day Playbook
Here's how to analyse and optimise your cost structure:
Week 1-2: Cost Classification Audit
Objective: Accurately categorise every expense as fixed or variable.
- Export complete expense data for past 12 months
- List every expense category
- For each, determine: Does this scale with order volume?
- Create three buckets: Pure Fixed, Pure Variable, Mixed (semi-variable)
- For Mixed expenses, estimate the fixed vs. variable component
Common misclassifications:
- Staff salaries classified as fixed when significant overtime scales with volume
- Warehouse rent classified as fixed when you're in overflow storage during peaks
- Marketing classified as variable when brand spend is actually fixed commitment
Deliverable: Complete cost classification with fixed/variable split.
Week 3-4: Leverage Metrics Calculation
Objective: Calculate your current operating leverage and breakeven point.
- Calculate total fixed costs per month
- Calculate variable cost as percentage of revenue
- Calculate contribution margin percentage
- Determine breakeven revenue: Fixed Costs / Contribution Margin %
- Calculate DOL at current revenue level
Key questions to answer:
- What revenue level covers fixed costs?
- How far above breakeven are you currently operating?
- What happens to profit if revenue drops 20%?
- What happens if revenue grows 20%?
Deliverable: Leverage analysis document with scenario projections.
Week 5-6: Structure Optimisation Analysis
Objective: Identify opportunities to improve your cost structure.
For each major fixed cost, ask:
- Is there a variable alternative that would cost less at current scale?
- At what scale does the fixed cost become more efficient?
- What's the cost of flexibility lost by committing to fixed?
For each major variable cost, ask:
- Is there a fixed alternative that would cost less at current scale?
- What scale would be required to justify fixed investment?
- What operational improvements come with fixed alternatives?
Build scenarios:
- Current structure projected forward 24 months
- Higher-fixed alternative (bring fulfillment in-house, build team, etc.)
- Higher-variable alternative (outsource more, use platforms, etc.)
Compare profit, risk, and capital requirements across scenarios.
Deliverable: Cost structure scenario analysis with recommendations.
Week 7-8: Implementation Planning
Objective: Create actionable plan for cost structure optimisation.
- Prioritise changes by impact and feasibility
- Sequence transitions to minimise disruption
- Identify trigger points (revenue levels, margin thresholds) for future changes
- Build monitoring dashboard for ongoing leverage management
- Document decision criteria for future cost structure decisions
Deliverable: Cost structure implementation roadmap.
Managing Leverage Through Growth Stages
Your optimal cost structure changes as the business evolves. Here's stage-appropriate guidance:
Early Stage ($0-$1M Revenue)
Priority: Survival and validation. Minimise fixed commitments.
Recommended structure: 70%+ variable cost ratio
- Use 3PL fulfillment
- Leverage marketplace platforms
- Outsource non-core functions
- Focus marketing on measurable performance
Key metric: Cash runway. How long until you must be profitable?
Growth Stage ($1M-$5M Revenue)
Priority: Find optimal unit economics while scaling.
Recommended structure: 50-60% variable cost ratio
- Evaluate in-house vs. outsourced on case-by-case basis
- Build small core team for key functions
- Invest in systems that scale
- Begin brand-building alongside performance marketing
Key metric: Contribution margin trajectory. Are unit economics improving as you scale?
Scale Stage ($5M+ Revenue)
Priority: Maximise profit from proven model.
Recommended structure: 40-50% variable cost ratio
- Own strategic infrastructure (fulfillment, technology)
- Build specialised internal teams
- Invest in automation to reduce variable labour costs
- Balance brand and performance marketing
Key metric: Operating leverage. How much profit expansion do you get from revenue growth?
11.3% Amazon margin in Q4 2024 as benchmark. This level of margin typically requires significant operational scale and infrastructure investment—a high-fixed-cost model justified by massive volume.
The Leverage Dashboard
Track these metrics monthly to manage operational leverage:
Primary Metrics:
- Contribution Margin % (CM1, CM2, CM3)
- Fixed Cost Base (absolute dollars)
- Fixed Cost Ratio (fixed costs / revenue)
- Breakeven Revenue
- Degree of Operating Leverage
Trend Indicators:
- Revenue volatility (standard deviation of monthly revenue)
- Fixed cost creep (are fixed costs growing faster than revenue?)
- Margin stability (is contribution margin consistent or erratic?)
Warning Signs:
- Breakeven revenue exceeding 70% of typical monthly revenue (too little buffer)
- Fixed costs growing faster than revenue (losing scale benefits)
- CM3 below 10% (insufficient cushion for fixed costs)
- DOL above 5x with revenue volatility above 15% monthly (dangerous combination)
The Australian Context
Australian ecommerce operators face specific leverage considerations:
Higher Base Costs: Wages, rent, and compliance costs run higher than US equivalents. This pushes breakeven points higher and makes the fixed/variable decision more consequential.
Smaller Total Market: The Australian market is roughly 1/15th the US market. Scale advantages max out faster, meaning some fixed cost investments never pay off the way they would in larger markets.
Geographic Distribution: Shipping across vast distances creates variable cost challenges. Fulfillment from multiple locations (splitting fixed costs) may not be viable until much larger scale than US equivalents.
Currency Exposure: Businesses sourcing product internationally face exchange rate volatility. This can turn what appears to be a stable cost structure into a variable one when currency swings hit COGS.
Recommendation: Australian operators should lean slightly more toward variable cost structures than global benchmarks suggest, retaining flexibility until scale clearly justifies fixed investment.
From Leverage Understanding to Leverage Advantage
Understanding your cost structure isn't enough—you need to use that understanding strategically.
When demand is predictable and growing: Lean into fixed costs. Lock in capacity, build infrastructure, invest in systems. The leverage will amplify your growth into outsized profit expansion.
When demand is uncertain or volatile: Stay flexible. Accept lower peak margins in exchange for lower downside risk. Variable costs let you breathe when revenue fluctuates.
When competing against established players: Consider whether you can operate with a different cost structure that creates advantage. If competitors carry heavy fixed costs, your variable model gives you flexibility they lack.
The New North Star Metric: Leverage-Adjusted Return
Stop tracking operating margin alone. Start measuring Leverage-Adjusted Return (LAR)—your profit return normalised for the operating leverage risk embedded in your cost structure.
The Calculation:
LAR = Operating Margin % / Degree of Operating LeverageInterpretation:
- LAR > 5%: Strong risk-adjusted returns—margin justifies leverage
- LAR 2-5%: Acceptable—returns adequately compensate for structure
- LAR 1-2%: Marginal—high leverage with thin margin buffer
- LAR < 1%: Dangerous—operating leverage exceeds margin protection
This metric reveals whether your profitability adequately compensates for the risk embedded in your cost structure. A 15% margin with 5x leverage (LAR = 3%) may be less sustainable than a 10% margin with 2x leverage (LAR = 5%).
The Leverage Balance
contribution profit banked over fixed costs drives profitability. That simple statement captures the essence of leverage management: generate enough contribution margin to exceed fixed costs, then optimise the mix to maximise the gap between contribution and fixed.
Your cost structure is a strategic choice, not an accident. Make it deliberately.
Unit Economics Calculator
Contribution margin per order after COGS, shipping and fees — the number scaling actually depends on.
Break-Even Analysis Calculator [Tool]
Break-Even Analysis Template for Ecommerce
Unit Economics Checklist: Contribution Margin
Contribution Margin Calculator by Product [Tool]
Checklist: Fixed vs Variable Costs for Startups
The Unit Economics Command Centre: Building Your Profitability Dashboard
Newsletter
The Uncommon Insights Letter
Practical FMCG & eCommerce growth playbooks — margins, retention and scaling tactics, straight to your inbox.
Turn unit economics into profit you can see
Get a hands-on operator to turn the frameworks above into results — book a free audit call.