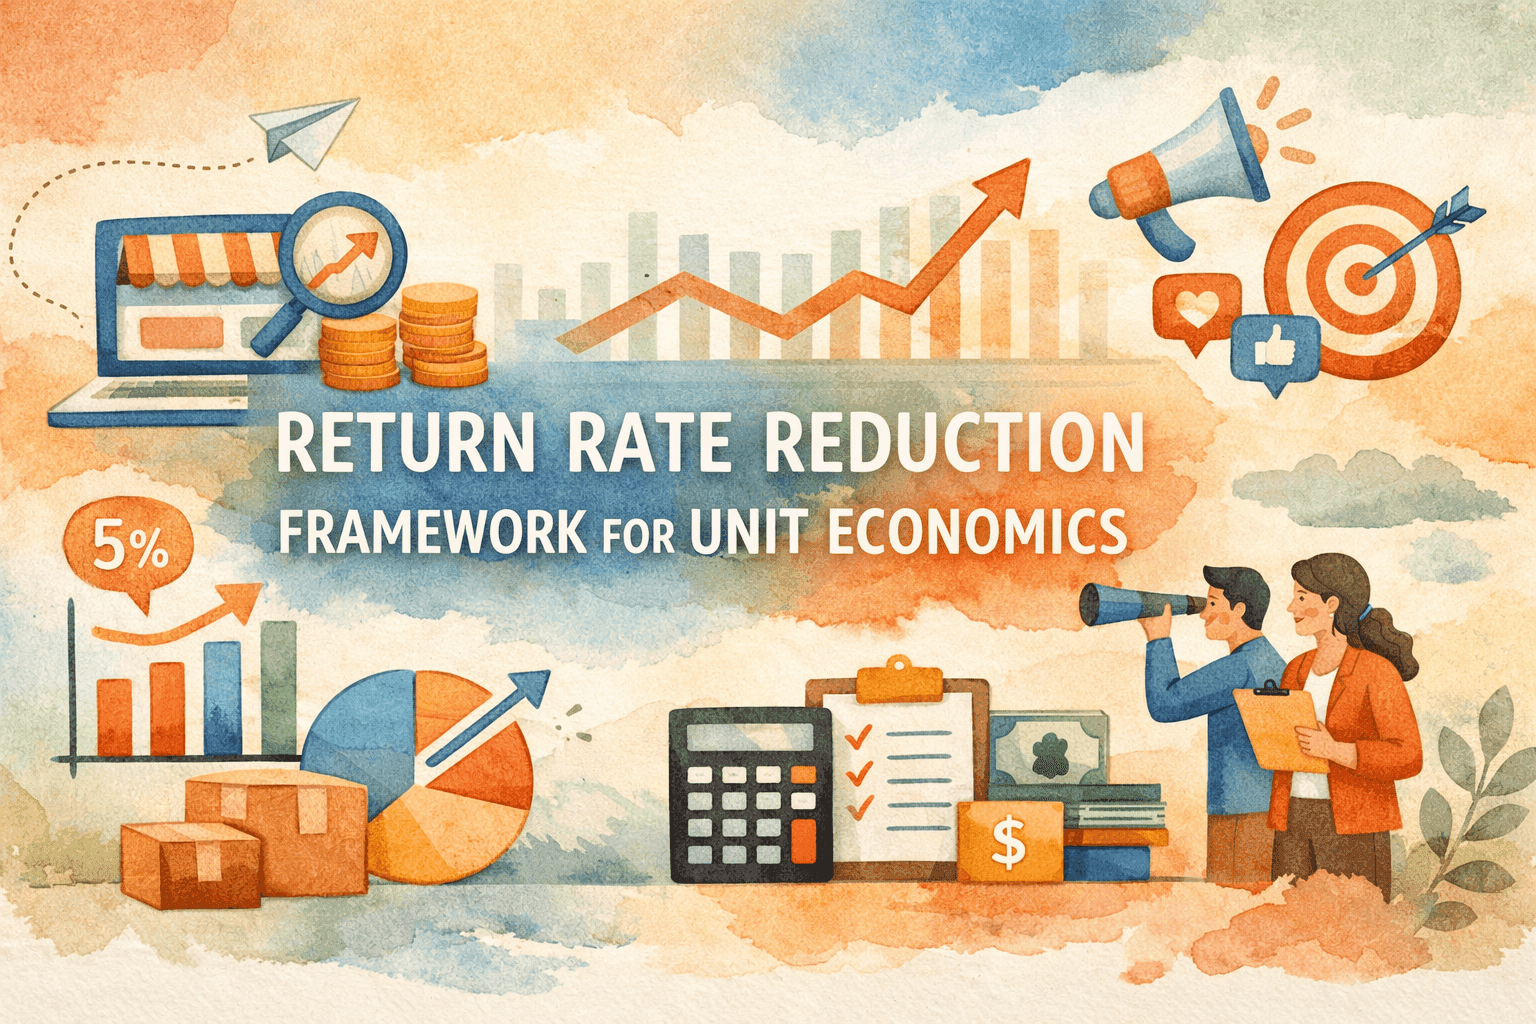
Return Rate Reduction Framework for Unit Economics
Reduce ecommerce return rates to protect profit margins. Framework for improving product presentation, sizing accuracy, and return policy optimization.
8 min read · 10 May 2025
The $890 Billion Margin Destroyer
Returns are the silent killer of ecommerce profitability. Every returned item represents not just lost revenue, but active cost destruction.
The average return rate for ecommerce was 16.9% in 2024, according to the National Retail Federation. That means nearly one in six products sold online comes back. For fashion retailers, the rate often exceeds 25-30%.
The scale is staggering. Consumers returned products worth a staggering $890 billion in 2024, according to NRF data. That's not just a logistics challenge-it's an existential threat to unit economics.
And the cost goes far beyond the refund. The cost to process a return can be anywhere from 20%–65% of the item's original value when accounting for shipping, restocking, inspection, and loss of value. A $100 item that gets returned might cost you $20-$65 beyond the refund itself.
Most ecommerce operators treat returns as a cost of doing business-an inevitable expense that simply gets absorbed into operating costs. This is a mistake. The standard practice of accepting industry-average return rates as "normal" is negligent margin management.
The truth: returns are a controllable expense with massive margin impact. The operators who treat return rate optimisation as a core competency rather than an afterthought consistently outperform their competitors on profitability, even at similar revenue levels.
Understanding the True Cost of Returns
Returns destroy margin through multiple cost centres that compound against profitability.
Return Cost Breakdown:
| Cost Component | Typical Cost | Example ($80 Item) |
|---|---|---|
| Return shipping | $8-$12 | $10 |
| Processing/inspection | $5-$8 | $6 |
| Restocking | $2-$4 | $3 |
| Value depreciation | 10-30% | $12 |
| Customer service | $2-$5 | $3 |
| Total Return Cost | 20-65% of price | $34 (42.5%) |
On that $80 item, the return doesn't just cost you the $80 refund-it costs you an additional $34 in processing, shipping, and value loss. If your contribution margin was $32 on that product, you've now lost $66 on that transaction.
Category-Specific Return Rates:
Online return rates are approximately three times higher than in-store purchases, with significant variation by category:
| Category | Average Return Rate | Primary Drivers |
|---|---|---|
| Apparel/Fashion | 25-40% | Fit, sizing, colour |
| Footwear | 20-30% | Fit, comfort |
| Electronics | 15-20% | Compatibility, expectations |
| Home/Furniture | 10-15% | Size, appearance |
| Beauty/Cosmetics | 4-8% | Sensitivity, colour match |
| Books/Media | 5-8% | Condition, duplicates |
Understanding your category baseline helps set realistic reduction targets.
The Return Reduction Protocol
The Return Reduction Protocol addresses returns through prevention, friction, and recovery-in that priority order. This systematic approach transforms return management from a reactive cost centre into a proactive profit protection strategy.
In my experience, most brands approach returns backwards-they focus on processing efficiency and customer experience while ignoring prevention. An apparel brand I worked with reduced returns from 32% to 19% not by making returns harder, but by implementing better sizing tools and product photography. That 13-point improvement translated to over $180,000 in annual margin recovery on $3M revenue.
Pillar 1: Prevention-Stop Returns Before They Happen
The cheapest return is one that never occurs. Prevention focuses on helping customers make confident purchase decisions.
Product Presentation Optimisation:
Damage or defect is the top reason for returns, followed by item not matching description. Address these through superior product presentation:
1. Multiple high-quality images: Show every angle, close-up details, scale references 2. Video demonstrations: Products in use, showing functionality and features 3. Accurate colour representation: Calibrated imagery across devices 4. Complete specifications: Dimensions, materials, weight, compatibility 5. Honest descriptions: Underpromise and overdeliver rather than the reverse
Sizing and Fit Solutions:
A significant 63% of consumers purchase products in multiple sizes and return items that don't fit-a practice called "bracketing" that inflates return rates and costs.
Combat bracketing with:
- Detailed size guides: Not just measurements, but how to measure
- Fit predictor tools: AI-powered recommendations based on body measurements
- Customer reviews with sizing: "I'm usually a medium, this fit true to size"
- Comparison to known brands: "Fits like Nike medium"
- AR try-on technology: Virtual fitting rooms for apparel and accessories
Customer Education:
Help customers understand products before purchase:
- FAQ sections addressing common concerns
- Buying guides for complex products
- Live chat for pre-purchase questions
- Video tutorials for assembly or use
Quality Control:
Returns from defective products are entirely preventable:
- Pre-shipment inspection for high-value items
- Supplier quality requirements and audits
- Improved packaging to prevent transit damage
- Batch tracking to identify quality issues quickly
Pillar 2: Friction-Make Returns Thoughtful, Not Automatic
Strategic friction doesn't prevent legitimate returns-it reduces impulsive and fraudulent returns while maintaining customer satisfaction.
Return Window Optimisation:
| Window Length | Impact |
|---|---|
| 14 days | Lower returns, may reduce purchase confidence |
| 30 days | Industry standard, balanced |
| 60 days | Higher initial purchases, moderate return increase |
| 90+ days | Highest purchase rates, highest returns |
Shorter windows don't always mean fewer returns-they can reduce purchase confidence. The optimal window varies by product type and customer segment. Test to find your balance.
Return Process Design:
The goal isn't making returns difficult-it's making them intentional:
- Require reason selection (provides data for prevention)
- Show exchange options before refund (recover the sale)
- Offer store credit with bonus (10% extra as credit)
- Provide sustainability messaging (returns' environmental impact)
Restocking Fee Considerations:
Restocking fees (typically 10-20%) can reduce returns but also reduce purchase confidence. Consider:
- Category-specific fees (electronics yes, apparel no)
- Waiver for exchanges (encourage alternatives)
- Clear upfront communication (no surprises)
Pillar 3: Recovery-Minimise Loss When Returns Happen
When returns are inevitable, recover as much value as possible.
Exchange Over Refund:
An exchange maintains the sale and often creates a satisfied customer. Prioritise exchanges by:
- Showing exchange options before refund options
- Offering free shipping on exchanges
- Enabling instant exchanges with size/colour swap
- Training customer service to offer alternatives
Store Credit Incentives:
Research shows that 84% of UK consumers would not buy from a brand again after a poor return experience, so maintaining the relationship matters. Store credit keeps customers in your ecosystem:
- Offer bonus credit (10-15% extra) vs. refund
- Set reasonable expiration (12 months minimum)
- Enable immediate use (even on the exchange order)
Resale Value Protection:
Returned items often can't be resold at full price. Minimise depreciation:
- Quick processing (fashion items lose value weekly)
- Efficient grading system (A/B/C condition categories)
- Outlet/seconds channel for imperfect items
- Liquidation partnerships for unsaleable inventory
Returnless Refunds:
For low-value items where return shipping exceeds item value:
- Refund without requiring return
- Request product donation to charity
- Save shipping cost while creating goodwill
Category-Specific Return Strategies
Different categories require different approaches.
Apparel/Fashion (25-40% returns):
- Primary cause: Fit and sizing issues
- Prevention focus: Size guides, fit predictors, customer photos
- Policy approach: Free exchanges, modest return friction
- Recovery priority: Exchange program, seasonal liquidation
Footwear (20-30% returns):
- Primary cause: Comfort and fit
- Prevention focus: 3D foot scanning, true-to-size ratings, break-in guidance
- Policy approach: Exchange incentives, worn-shoe restrictions
- Recovery priority: Outlet channel for tried-on pairs
Electronics (15-20% returns):
- Primary cause: Compatibility, unmet expectations
- Prevention focus: Compatibility checkers, detailed specs, video demonstrations
- Policy approach: Restocking fees for opened items, longer windows for sealed
- Recovery priority: Refurbishment and certified pre-owned channel
Home/Furniture (10-15% returns):
- Primary cause: Size mismatch, colour/appearance
- Prevention focus: AR room visualisation, dimensional comparison tools
- Policy approach: White glove return service, assembly-related exclusions
- Recovery priority: Floor model sales, discount outlet
The Bracketing Problem
The average retail return rate is 24.5% for eCommerce and 8.71% for in-store purchases-a 3x difference largely driven by bracketing.
Bracketing-buying multiple sizes/colours with intent to return-is rational customer behaviour given free returns, but devastating to unit economics.
Anti-Bracketing Strategies:
1. Confidence tools: If customers trust sizing guidance, they won't bracket 2. Return analytics: Identify serial bracketers, adjust their experience 3. Incentivise confidence: Discount for single-size orders 4. Shipping differentiation: Free shipping on single items, paid on multiples 5. Post-purchase engagement: "Need a different size? Tell us before we ship"
Bracketing Economics:
A customer orders 3 sizes at $80 each ($240), keeps 1, returns 2.
- Revenue: $80
- Return shipping: $20 (2 × $10)
- Processing: $12 (2 × $6)
- Net contribution: $80 - $32 - $32 = $16 (vs. $32 if no bracketing)
Bracketing cut contribution margin in half-and this customer paid full price.
Return Fraud Prevention
Fraudulent returns cost retailers $103.8 billion in 2024, representing 15.1% of all retail returns.
Common Fraud Types:
| Fraud Type | Description | Prevalence |
|---|---|---|
| Wardrobing | Wear item, return as "unused" | 60% of return fraud |
| Receipt fraud | Returning stolen items | 15% |
| Price arbitrage | Return higher-priced version | 10% |
| Empty box | Claim item not received or return empty | 10% |
| Counterfeit swap | Return fake, keep authentic | 5% |
Fraud Prevention Measures:
- Return history tracking: Identify high-frequency returners
- Verification requirements: ID verification for high-value returns
- Serial number tracking: Ensure returned item matches sold item
- Package weight verification: Detect empty box fraud
- Return-limit policies: Cap returns per customer/period
- AI fraud detection: Pattern recognition across customer behaviour
The 60-Day Return Reduction Sprint
Phase 1: Analysis (Days 1-15)
Week 1: Return Data Audit
- Calculate return rate by product category
- Identify top 20 products by return volume
- Analyse return reasons by category
- Calculate true cost of returns
Week 2: Root Cause Analysis
- Survey recent returners about reasons
- Review product page content for top-returned items
- Audit size guides and specifications
- Identify quality issues in returns
Phase 2: Prevention Implementation (Days 16-40)
Week 3-4: Product Page Improvements
- Add photos/videos to top-returned products
- Update descriptions with commonly cited issues
- Improve size guides based on return feedback
- Add customer photos showing fit/scale
Week 5-6: Process Improvements
- Implement exchange-first return flow
- Add reason capture to returns process
- Launch store credit incentive (10% bonus)
- Set up returnless refund threshold
Phase 3: Optimisation (Days 41-60)
Week 7-8: Policy Testing
- A/B test return window length
- Test restocking fee on select categories
- Implement bracketing detection
- Launch post-purchase size confirmation
Week 9-10: Measurement and Iteration
- Compare return rates to baseline
- Calculate cost savings from reduction
- Identify remaining problem products
- Plan ongoing optimisation cadence
Return Metrics Dashboard
Track these metrics monthly:
| Metric | Calculation | Target |
|---|---|---|
| Overall Return Rate | Returns ÷ Orders | <15% (category-dependent) |
| Return Cost % | Total return cost ÷ Returned revenue | <40% |
| Exchange Rate | Exchanges ÷ Total returns | >30% |
| Repeat Return Rate | Customers with 2+ returns ÷ All returners | <20% |
| Return Reason Mix | % by category (fit, quality, etc.) | Shifting toward controllable |
| Days to Process | Average return processing time | <7 days |
The Financial Impact of Return Reduction
Calculate the impact of return rate improvements:
Baseline:
- Annual revenue: $2,000,000
- Return rate: 20%
- Returns value: $400,000
- Return cost (40%): $160,000
- Net return cost: $160,000
After 25% Reduction:
- Return rate: 15%
- Returns value: $300,000
- Return cost: $120,000
- Annual savings: $40,000
Plus recovered margin on $100,000 of prevented returns (say 35% CM): $35,000
Total annual impact: $75,000 from reducing return rate by 5 percentage points.
The New North Star Metric: Net Revenue Yield
Stop tracking return rate in isolation. Start measuring Net Revenue Yield (NRY)-the percentage of gross revenue that remains after all return-related costs.
The Calculation:
NRY = (Gross Revenue - Refunds - Return Processing Costs) / Gross Revenue × 100Interpretation:
- NRY > 95%: Excellent-minimal return leakage
- NRY 90-95%: Acceptable-typical for ecommerce
- NRY 85-90%: Concerning-return costs impacting profitability
- NRY < 85%: Critical-return economics threatening viability
This metric captures the complete return impact-not just the refund, but all processing, shipping, and value loss costs. It reveals how much of every dollar actually becomes retained revenue.
The Return Impact
Returns aren't just an operational inconvenience-they're a direct assault on your unit economics. Every point of return rate reduction drops directly to contribution margin.
The operators who systematically prevent returns, thoughtfully add friction, and efficiently recover value don't just save money-they build competitive advantage through better customer experiences that happen to cost less.
Your margins are hiding in your returns. Go find them.
Unit Economics Calculator
Contribution margin per order after COGS, shipping and fees — the number scaling actually depends on.
Shipping Cost Optimization: Unit Economics of Free Shipping
eCommerce Return Rates by Channel 2025
Contribution Margin Calculator by Product [Tool]
Why Shopify Returns Management Apps Beat Cash Refunds
Break-Even Analysis Calculator [Tool]
Payment Processing Fee Optimization for Ecommerce
Newsletter
The Uncommon Insights Letter
Practical FMCG & eCommerce growth playbooks — margins, retention and scaling tactics, straight to your inbox.
Turn unit economics into profit you can see
Get a hands-on operator to turn the frameworks above into results — book a free audit call.