How to Measure ROI for Holiday Campaigns
Calculate true ROI for holiday campaigns: include all costs, choose the right attribution model and use incrementality testing to confirm real lift.
26 January 2026
- Testing in Preparation for the Holiday Season
- The ROI Formula for Holiday Campaigns
- Identifying and Categorising Campaign Costs
- Attributing Revenue to Holiday Campaigns
- Step-by-Step ROI Calculation with Australian Examples
- Tools and Platforms for Tracking ROI
- Common ROI Measurement Challenges and Solutions
- Conclusion
Holiday campaigns can drive big sales, but are they truly profitable? Many businesses in Australia focus on revenue without considering the actual return on investment (ROI). Here's how you can calculate and improve ROI for your holiday marketing efforts:
- ROI Formula: Use (Revenue – Marketing Cost) / Marketing Cost × 100 to measure profitability.
- Include All Costs: Factor in ad spend, creative production, staff salaries, software, fulfilment, and overheads.
- Benchmark Goals: Aim for a 5:1 return ratio (earning $5 for every $1 spent) as a strong performance indicator.
- ROI vs ROAS: ROI measures profitability, while ROAS (Return on Ad Spend) only tracks revenue from ads.
- Attribution Models: Multi-touch attribution gives a clearer view of which marketing efforts contribute to sales.
- Incrementality Testing: Test if your campaigns generate new sales or just capture existing intent.
Testing in Preparation for the Holiday Season
The ROI Formula for Holiday Campaigns
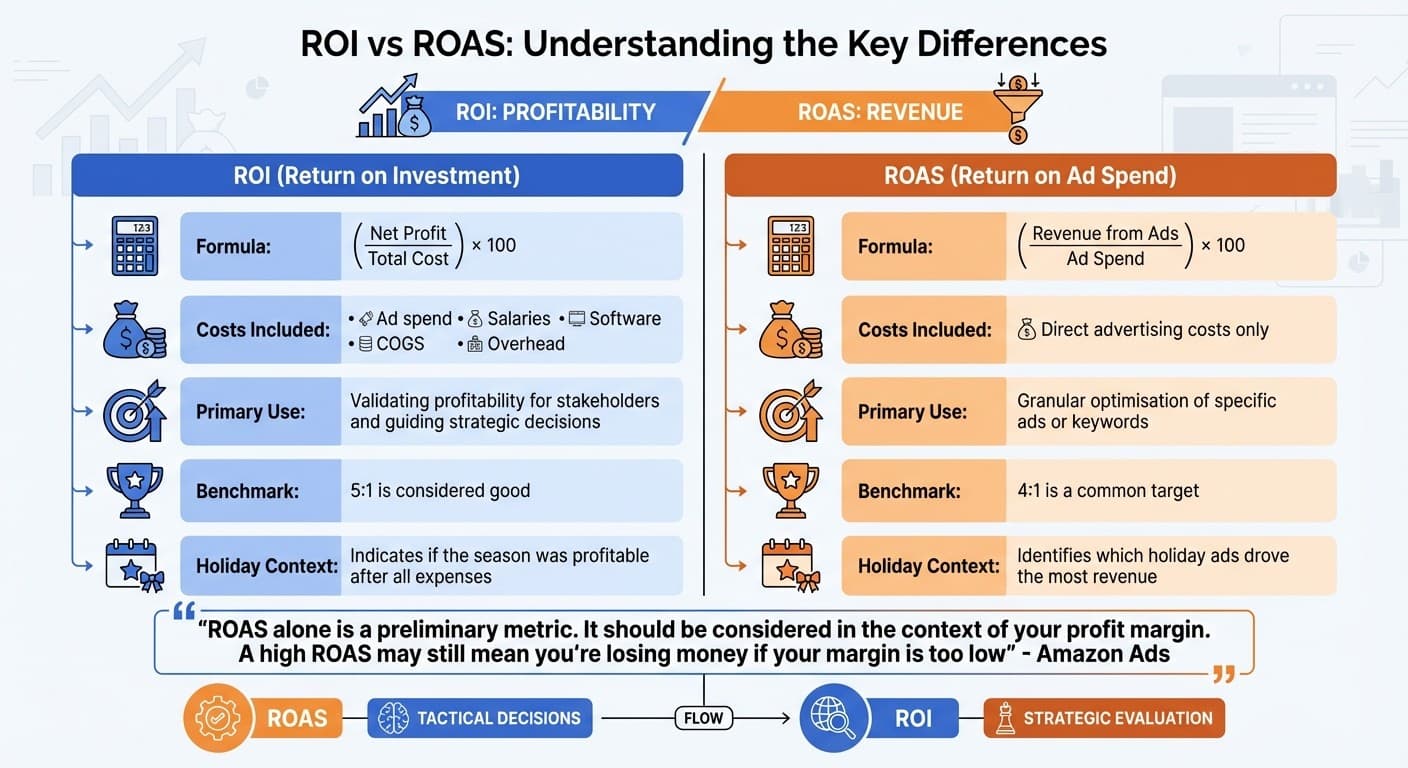
ROI vs ROAS: Key Differences for Holiday Campaign Measurement
The formula for calculating ROI is: (Revenue – Marketing Cost) / Marketing Cost × 100. When it comes to holiday campaigns, this can be fine-tuned to: (Revenue Attributed to Campaign − Campaign Costs) / Campaign Costs × 100. This percentage reveals how much profit you're earning for every dollar you spend.
For Australian eCommerce businesses, it's crucial to include all campaign-related expenses. It's not just the $5,000 spent on Facebook ads during Boxing Day sales. You also need to factor in costs like creative production, marketing software subscriptions, staff salaries for managing the campaign, and even fulfilment charges. Overlooking these can make a campaign that’s barely breaking even appear more successful than it actually is.
For a more comprehensive picture, consider using Net Income ROI: (Net Income / Total Investment) × 100. This approach provides a clearer view of actual profitability, which is particularly useful for stakeholders.
To ensure your campaign is genuinely profitable, aim for an ROI that exceeds industry standards. A ratio of 5:1 (earning $5 for every $1 spent) is widely regarded as strong, while 10:1 is exceptional. On the other hand, a 2:1 ratio is often just scraping by - once you account for overheads like rent and utilities, it may barely break even.
ROI vs ROAS: Key Differences
ROI and ROAS serve different purposes. While ROI measures overall profitability, ROAS focuses on the gross revenue generated per dollar of ad spend. The formula for ROAS is: (Revenue from Ads / Ad Spend) × 100. This makes ROAS ideal for fine-tuning specific ad sets or keywords, such as during a Click Frenzy campaign, but it doesn’t reflect actual profitability.
| Feature | ROI (Return on Investment) | ROAS (Return on Ad Spend) |
|---|---|---|
| Formula | (Net Profit / Total Cost) × 100 | (Revenue from Ads / Ad Spend) × 100 |
| Costs Included | Ad spend, salaries, software, COGS, and overhead | Direct advertising costs only |
| Primary Use | Validating profitability for stakeholders and guiding strategic decisions | Granular optimisation of specific ads or keywords |
| Benchmark | 5:1 is considered good | 4:1 is a common target |
| Holiday Context | Indicates if the season was profitable after all expenses | Identifies which holiday ads drove the most revenue |
As Amazon Ads explains:
"ROAS alone is a preliminary metric. It should be considered in the context of your profit margin. A high ROAS may still mean you're losing money if your margin is too low".
ROAS is excellent for making tactical decisions, like determining which ads to scale up. However, ROI is the metric to rely on when evaluating the overall success of your EOFY campaign and whether it was worth the investment.
Now that you understand the formulas and differences, the next step is to ensure all campaign costs are categorised accurately.
Identifying and Categorising Campaign Costs
To effectively measure ROI, it’s essential to categorise every campaign expense accurately. This goes beyond just tracking advertising spend - every cost tied to your campaign matters.
Direct ad spend includes costs like cost-per-click (CPC), cost-per-thousand impressions (CPT), platform listing fees (e.g., Amazon or eBay), and affiliate commissions. Keep in mind that during peak shopping periods like Black Friday, CPC rates can surge by as much as 25%.
Don’t forget about creative production costs. Whether you’re hiring a third-party agency, working with freelancers, or relying on your in-house team, these expenses must be factored into your calculations. Ignoring them can lead to an inflated ROI.
Operational and fulfilment costs often get overlooked, especially in simpler ROAS calculations. These include shipping fees, transaction charges, inventory management, and the cost of goods sold (COGS). These costs can significantly affect your net profit. As Salesforce aptly points out:
"To get an accurate ROI, you need to clearly connect sales to specific marketing efforts... Make sure to include all costs related to the campaign, not just advertising space".
Additional expenses like software subscriptions, equipment depreciation, and management time spent on campaign oversight should also be included. Australian marketers spend billions on digital ads, but failing to account for these less obvious costs means you’re measuring revenue rather than actual profit.
Ad Spend and Creative Production
While ad spend is the most visible expense, it’s only one piece of the puzzle. During key Australian shopping events like EOFY, Black Friday, and Cyber Monday, competition heats up, pushing bidding costs higher. Before increasing your bids, calculate your break-even ROAS using this formula: 1 ÷ Gross Profit Margin. For instance, if your margin is 40%, you’ll need a ROAS of at least 2.5:1 to break even.
Creative production costs can also climb quickly. Whether outsourcing to agencies or leveraging your in-house team, ensure every related expense is accounted for. These costs are just as critical as ad spend when calculating your total campaign investment.
Once ad and creative costs are clear, you can move on to operational expenses to uncover your true profit margins.
Operational and Fulfilment Costs
Operational costs often highlight the gap between a promising ROAS and actual ROI. When you factor in shipping fees, transaction charges, and COGS, your net profit may look quite different from initial projections.
For EOFY campaigns designed to clear inventory, it’s worth tracking inventory ROI - calculated as Gross Profit divided by Average Inventory Cost. This helps you understand how effectively your stock investment is generating returns.
Staffing expenses can rise during high-demand periods. Whether you’re hiring temporary workers, paying overtime, or working with third-party logistics providers, these costs should be included in your calculations. Additionally, Australian businesses running in-person events (like pop-up shops or customer appreciation gatherings) often forget to account for venue hire, food vendors, or brand ambassador fees. By capturing every expense, you’ll get a clearer picture of whether your campaign is truly profitable or simply delivering a surface-level ROAS.
Attributing Revenue to Holiday Campaigns
Once you've categorised all costs, the next step is to trace which sales originated from your holiday campaign. This process, known as attribution, assigns credit to the various touchpoints that influence a customer's purchase journey.
Single-touch attribution models, like First-Click or Last-Click, assign all the credit to just one interaction, leaving out the contributions of other channels. Avinash Kaushik, Chief Strategy Officer at Human Made Machine, highlights the limitations of this approach:
"If a significant share of your conversions have a greater than one path length, you have an attribution problem".
For Australian retailers running multi-channel campaigns during events like EOFY or Boxing Day, relying solely on Last-Click attribution can skew results. For instance, retargeting ads might take all the credit, while earlier brand awareness efforts go unnoticed.
Multi-touch attribution (MTA) offers a more balanced perspective by distributing credit across multiple touchpoints. A good starting point is the Time Decay model, which gives more weight to interactions closer to the purchase. This approach often aligns with typical holiday shopping behaviour. For higher-consideration purchases, a U-Shaped model can be effective, allocating 40% of the credit to the first interaction, 40% to the last, and 20% to the steps in between.
Direct Attribution and Multi-Touch Models
Choosing the right attribution model is critical for calculating ROI accurately. For example, a Last-Touch model might show a high ROAS for a retargeting campaign, but it could overemphasise that channel while undervaluing earlier touchpoints, like social media ads that first captured the audience's attention. On the other hand, Linear attribution, which divides credit equally among all interactions, assumes every touchpoint has the same impact - something that rarely reflects reality.
Interestingly, 90% of US sales and marketing teams report a disconnect between their departments, a gap that effective revenue attribution can help close. Before diving into attribution analysis, ensure all your holiday campaigns are tagged with consistent UTM parameters (like source, medium, and campaign). Inconsistent tracking can fragment your data, making it unreliable. Tools like Google Ads provide attribution reports with lookback windows of up to two years, giving you a broader view of how customers interact with your campaigns over time.
By clarifying revenue paths, attribution sets the groundwork for testing the actual impact of your campaigns.
Incrementality Testing for Holiday Campaigns
Attribution tells you which touchpoints customers engaged with, but it doesn’t confirm whether your ads were the reason for the purchase. That’s where incrementality testing comes in. As Olivia Kory, Head of Go-To-Market at Haus, explains:
"Incrementality quantifies causation. It's a test that helps you quantify the incremental impact of your marketing activities".
The key metric here is Incremental Return on Ad Spend (iROAS), calculated as:
(Total Revenue - Baseline Revenue) ÷ Ad Spend.
Baseline revenue represents the sales you would have made without any advertising. During events like Boxing Day or Black Friday, many shoppers already plan their purchases in advance, meaning your ads might simply capture existing intent rather than generating new demand. Incrementality testing helps separate this baseline revenue from the true lift your campaign provides.
For Australian retailers, geographic testing is a practical method. For instance, you could run your campaign in Sydney and Melbourne while pausing it in Brisbane and Perth, then compare the sales lift between these regions. This approach is privacy-friendly and avoids reliance on cookies or device tracking - an increasingly valuable feature as third-party tracking becomes less effective. Adjusting your budget based on incremental lift can lead to a 15% to 40% improvement in overall ROAS for brands with significant holiday advertising investments.
When a well-executed incrementality test conflicts with your attribution model, trust the test. As Customer Science advises:
"When a model contradicts a well-designed test, the test wins".
This principle becomes especially important during high-stakes holiday seasons, where every dollar spent matters.
Step-by-Step ROI Calculation with Australian Examples
To calculate your ROI effectively, you can use the formula: (Revenue from Marketing - Marketing Cost) / Marketing Cost × 100. While the formula itself is straightforward, the real challenge lies in accurately tracking all expenses and properly attributing revenue to your campaign. Start by listing every cost and clearly assigning revenue portions, as outlined below.
First, list your total marketing expenses. These might include ad spend, creative fees, marketing tools, labour costs, and operational expenses. For Australian businesses, don’t forget to account for GST on ad spend, as this impacts your overall cost.
Next, assign revenue based on your chosen attribution model. For example, if you’re using a Time Decay model and it attributes 60% of a $500 sale to your campaign, you’d count $300 towards your revenue.
Australian digital campaigns often deliver ROI in the range of 200%-500%, though results can differ by channel. For instance, email marketing typically achieves an average ROI of 3,800%. A return ratio of 5:1 is considered excellent, while 2:1 is barely acceptable.
Case Study: EOFY Campaign ROI Calculation
Let’s look at an EOFY campaign run by a Melbourne office furniture retailer during 1–30 June 2025. The campaign targeted small businesses looking to make tax-deductible purchases.
Total Campaign Costs:
- Google Ads: $8,500
- Facebook and Instagram ads: $4,200
- Email marketing platform (monthly fee): $350
- Creative design and copywriting: $1,800
- Promotional shipping subsidy: $2,150
- Total Investment: $17,000
Revenue Attribution: Using a multi-touch attribution model, the retailer linked $94,500 in revenue to the campaign. After accounting for returns and cancellations, the adjusted revenue stood at $89,200.
ROI Calculation: ($89,200 - $17,000) / $17,000 × 100 = 424.7% ROI
This translates to a 5.2:1 return ratio, surpassing the 5:1 benchmark for exceptional marketing performance. Additionally, the retailer calculated their Marketing Efficiency Ratio (MER) by dividing total revenue ($89,200) by total marketing spend ($17,000), resulting in an MER of 5.2 - well above the ideal range of 3.0 to 5.0.
To ensure the campaign’s effectiveness, the retailer conducted an incrementality test. They compared sales in Sydney, where the campaign ran at full budget, to sales in Adelaide, where ad spend was halved. The Sydney market experienced a 38% sales lift compared to the previous June, while Adelaide only saw a 12% increase. This confirmed that the campaign drove genuine incremental revenue rather than simply capturing existing demand.
This example highlights the importance of meticulous cost tracking, accurate revenue attribution, and testing for incrementality to guide smarter budget decisions.
Tools and Platforms for Tracking ROI
Having the right tools to track ROI is essential for assessing the success of your holiday campaigns. These tools not only ensure you're making the most of your budget but also provide real-time insights into how effectively your spending translates into profit. To get accurate results, it’s crucial to use platforms that integrate seamlessly with your eCommerce systems. Let’s take a closer look at how platforms like GA4 work with eCommerce tools to monitor customer interactions.
Google Analytics and eCommerce Platforms
In Australia, many eCommerce businesses rely on GA4’s event-based tracking model to monitor customer activity during the holidays. Every interaction - whether it’s a page load, adding an item to the cart, or completing a purchase - is recorded as a distinct event. This level of detail is particularly valuable for holiday campaigns, as it allows you to track how shoppers move from browsing gift guides to making purchases.
For Shopify users, the Google & YouTube app makes integration with GA4 seamless. It automatically tracks key events such as add_to_cart, begin_checkout, and purchase, eliminating the need for manual coding. To enable year-on-year comparisons, it’s a good idea to extend GA4’s data retention settings to 14 months.
Shopify Analytics adds another layer of insight with over 60 pre-built dashboards. These dashboards provide data on sales by product type, traffic sources, and conversion rates - all included at no extra cost. Daniel Patricio, owner of Bull & Cleaver, shares his approach:
"I find Google Analytics is great for modelling visitor behaviours, whereas Shopify Reports is what I use for analysing our sell-through rates and merchandising mix".
For a broader view of multi-channel performance, tools like Triple Whale consolidate data from various platforms into a single dashboard. To ensure accurate traffic grouping, always include UTM parameters in your campaign links.
While these tools cover basic tracking, using specialised ROI calculators can provide deeper insights into profitability.
Marketing ROI Calculators and Custom Dashboards
Google Analytics is excellent at showing what’s happening, but understanding whether your campaigns are profitable requires more detailed analysis. While GA4 tracks gross revenue, true ROI calculations must also account for factors like shipping costs, transaction fees, and other expenses that often increase during the holiday season.
Shopify Seller Board is a helpful tool for this, offering real-time updates on profit margins. It takes into account hidden costs such as Australian shipping rates and transaction fees, giving you accurate insights during high-sales periods. This allows you to quickly shift resources to more profitable channels when needed.
For businesses using multi-touch attribution, Ruler Analytics is a game-changer. It tracks the entire customer journey across multiple channels and links each touchpoint to specific revenue outcomes. This is particularly useful during holiday campaigns when customers might discover your brand on Instagram, research on Google, and convert later through a retargeting ad. Jose Gallegos, Growth Marketer and Founder of Jose Angelo Studios, highlights the importance of this approach:
"The game of marketing ROI calculation has dramatically shifted toward multi-touch attribution. When I began 10 years ago, we mainly focused on last-click attribution. Now, my team tracks micro-conversions along the customer journey".
When choosing a dashboard or calculator, look for tools that measure Customer Lifetime Value (LTV) alongside Customer Acquisition Cost (CAC). Financial experts suggest aiming for an LTV:CAC ratio of 3:1 to ensure long-term profitability and sustainable growth. This analysis is particularly important for evaluating whether customers acquired during holiday promotions will continue to add value to your business in the future.
These tools build on the earlier discussion about cost attribution, helping ensure that every expense and revenue stream is accounted for with precision.
Common ROI Measurement Challenges and Solutions
Even with the best tools at your disposal, accurately measuring the ROI of holiday campaigns can be tricky. One of the biggest challenges is fragmented data across channels. This issue often arises when businesses use inconsistent UTM parameters. For instance, tagging one Instagram Story campaign as "IGstories" and another as "insta-stories" creates separate traffic groups in analytics, resulting in incomplete and unreliable insights. To address this, businesses need to establish consistent tagging practices and implement strong attribution frameworks to unify their data.
Another common pitfall is ignoring hidden costs like affiliate commissions, vendor fees, and labour, which can lead to an inflated ROI calculation. To avoid this, ensure your "cost" variable includes all expenses - such as production, shipping, fulfilment, and employee time devoted to managing campaigns. This comprehensive approach provides a more realistic view of profitability.
Overly simplistic attribution models also pose a challenge during the holiday season. Single-touch models, like first-click or last-click, fail to capture the complexity of customer journeys, especially during periods of high traffic. A better alternative is multi-touch attribution, which distributes credit across all touchpoints, offering a clearer picture of how various ads and channels contribute to sales.
Managing High Traffic and Cancellations
Operational challenges during peak periods can further complicate ROI measurement. Holiday traffic surges can overwhelm systems, making it harder to track performance accurately. The solution? Real-time monitoring. Dashboards that provide live updates on transaction data and customer behaviour allow you to identify and address issues - such as high cart abandonment or checkout delays - on the spot.
To protect your ROI during these high-traffic periods, focus on optimising your checkout process. Simplify the steps and remove unnecessary fields to reduce abandonment rates. Additionally, refine your paid search campaigns by using negative keywords to block irrelevant traffic. For example, during Boxing Day sales, excluding terms like "free" or "DIY" can help you avoid wasting ad spend on users unlikely to convert.
Post-Holiday Data Analysis
Once the holiday rush is over, it's time to analyse your campaign's true impact. Start by isolating campaign-attributable ROI. Subtract baseline organic growth from total sales to identify the revenue generated specifically by your holiday marketing efforts. This ensures you're not crediting your campaign for sales that would have occurred regardless.
A great example of post-holiday analysis comes from Ruby Friel, founder of Still Life Story, who used Shopify Analytics to review her store's holiday performance in 2024. By examining the "Sales by product variant" report, she pinpointed high-demand SKUs that outperformed others. This insight allowed her to focus her inventory investment and social media promotion on these products, significantly improving the efficiency of her marketing budget.
Also, evaluate your conversion rates by channel to determine which platforms - such as your website, email campaigns, or paid search - drove the most sales. Compare your seasonal Customer Acquisition Cost (CAC) to off-peak periods. Keep in mind that ad bid prices can skyrocket during the holidays, sometimes by as much as 140%. If your CAC was unusually high, use these insights to refine your targeting and creative strategies for next year. Lastly, don’t overlook hidden costs like social media management, agency fees, and fulfilment overhead when wrapping up your final calculations.
Conclusion
Tracking ROI for holiday campaigns isn't just about numbers; it's about gaining the clarity to make smarter decisions that fuel profitable growth. Without accurate ROI insights, you're essentially flying blind - unable to confirm if your marketing budget is driving sustainable customer acquisition or simply draining resources. As Jay Soni, Founder and Marketing Director of Yorkshire Fabric Shop, aptly states:
"The real question isn't, 'What's a good ROI?' but, 'Is this ROI driving meaningful growth for the business?'"
This perspective underscores how detailed cost attribution plays a crucial role in fostering genuine business growth.
True ROI goes beyond surface-level metrics - it accounts for all costs to paint a full picture of profitability. With this comprehensive understanding, you can better evaluate channel performance and reallocate budgets from underperforming tactics to strategies that yield stronger results.
By leveraging accurate cost attribution and the measurement techniques outlined earlier, ROI becomes more than a metric - it transforms into a strategic tool. It helps justify future budgets to stakeholders, balance short-term wins with long-term brand development, and refine your approach for upcoming campaigns. As we've seen through case studies and attribution strategies, early-funnel efforts often pave the way for high-value conversions later, making every holiday campaign an opportunity to learn and improve.
"Marketing ROI isn't a destination; it's a journey of constant refinement. Stay curious. Test relentlessly." - Arham Khan, Founder and CEO, Pixated
The businesses that consistently lead during peak seasons aren't necessarily the ones spending the most - they're the ones measuring effectively, learning quickly, and adapting intelligently. Use the fundamentals from this guide, benchmark your campaigns against industry standards, and apply these methods to fine-tune your strategy. With this approach, you'll be well-equipped to stay ahead during the busiest trading periods.
FAQs
How do I track all costs accurately when calculating ROI for holiday campaigns?
To get a clear picture of your holiday campaign's ROI, it's crucial to account for all associated costs. This means covering everything - from direct expenses like ad spend, production, and design to less obvious ones such as staff hours, software subscriptions, and platform fees.
Start by drafting a comprehensive budget before launching your campaign. Use tools like analytics platforms to keep tabs on spending across all channels. Make it a habit to update your records frequently to include any unexpected or additional costs. By doing this, your ROI calculations will reflect the full investment, giving you a more accurate measure of your campaign's performance.
What’s the difference between single-touch and multi-touch attribution models in holiday campaigns?
Single-touch attribution assigns all the credit for a conversion to a single interaction - usually the first or last touchpoint in a customer's journey. While straightforward, this method can miss the influence of other marketing efforts along the way.
On the other hand, multi-touch attribution distributes credit across multiple interactions. It provides a broader perspective on how various touchpoints work together to drive a sale. This approach is particularly helpful for analysing complex holiday campaigns that rely on multiple marketing channels and interactions.
What is incrementality testing, and how can it improve my campaign's ROI?
Incrementality testing is a powerful way to gauge the real impact of your holiday campaigns. Instead of relying on basic metrics like ROAS, which include all attributed revenue, this approach focuses on identifying the extra sales or conversions directly driven by your marketing efforts. It helps you separate the true effect of your ads from baseline sales that would have happened anyway.
How does it work? By using control groups that don’t see your ads, you can compare their outcomes with those exposed to your campaign. This comparison reveals the incremental lift - the additional results your ads have generated. Armed with this information, you can zero in on the channels and strategies that perform best, fine-tune your budget, and make sharper, data-backed decisions to boost your ROI.
In an era where privacy concerns are making traditional tracking less dependable, incrementality testing has become an invaluable tool for marketers aiming to stay ahead.
Related Blog Posts
How To Measure Content Marketing ROI For eCommerce
When to Use Incrementality vs. Attribution
Common Pitfalls in Social Media ROI Analysis
Why Shopify's AI Traffic Growth Breaks Traditional Attribution Models (And How to Fix Your CAC Calculation)
How to Map DTC Customer Touchpoints
eCommerce Unit Economics: A Complete Analysis Guide
Newsletter
The Uncommon Insights Letter
Practical FMCG & eCommerce growth playbooks — margins, retention and scaling tactics, straight to your inbox.
Turn these ideas into profit you can see
Get a hands-on operator to turn the frameworks above into results — book a free audit call.