10 A/B Testing Mistakes in eCommerce
Avoid common A/B testing pitfalls that waste time and revenue — from small sample sizes and early stops to mismatched messaging, speed and segmentation.
23 February 2026
- A/B Testing Course 029: Typical Mistakes While Running an A/B test.
- 1. Testing Multiple Variables at Once
- 2. Using Too Small a Sample Size
- 3. Testing Elements That Don't Matter
- 4. Stopping Tests Too Early
- 5. Testing Based on Guesses Instead of Data
- 6. Running Tests at Different Times
- 7. Mismatching Ad and Landing Page Messages
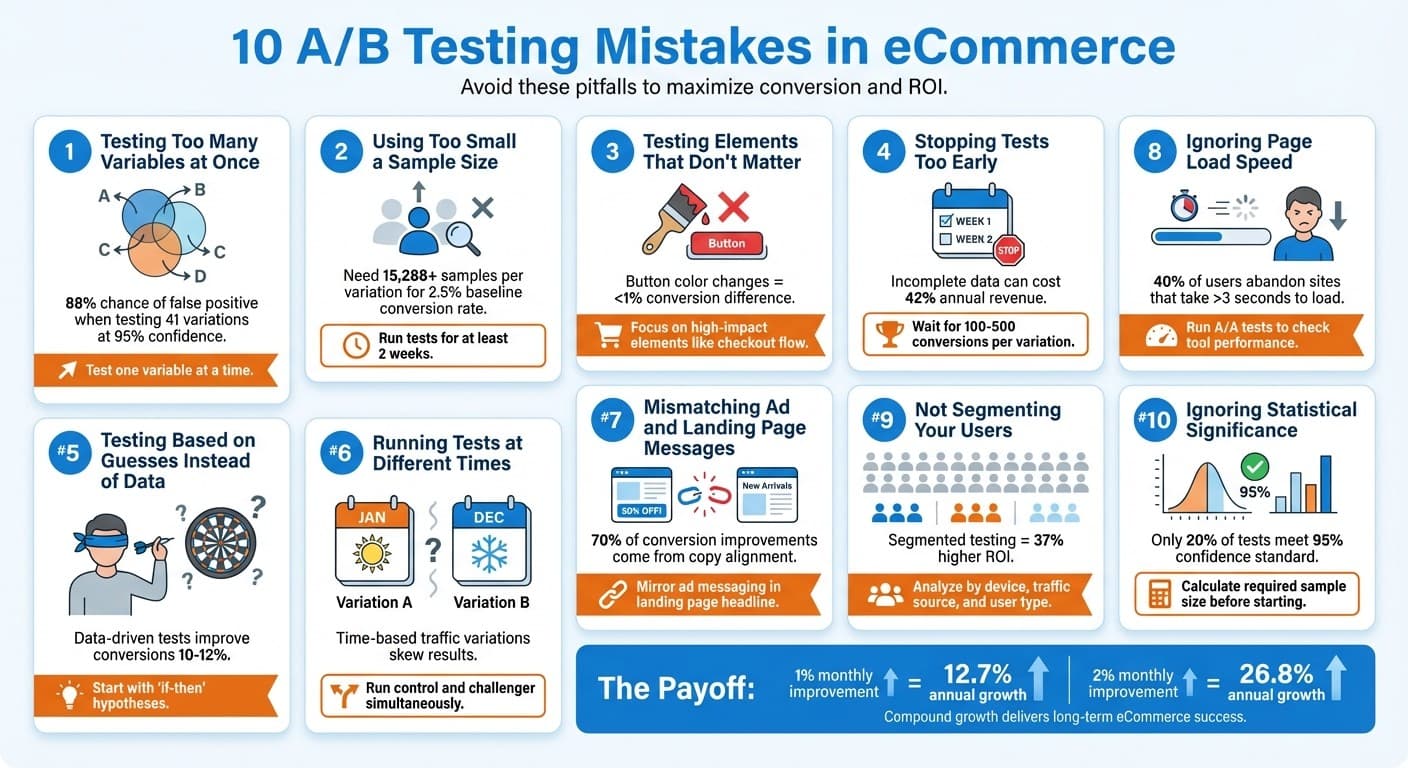
A/B testing is a powerful tool for improving eCommerce performance, but getting it wrong can lead to wasted time, money, and missed opportunities. Here are the 10 most common A/B testing mistakes that businesses make - and how to avoid them:
- Testing too many variables at once: Makes it impossible to identify what caused the change.
- Using too small a sample size: Leads to unreliable results and random conclusions.
- Testing elements that don’t matter: Focus on changes that impact conversions, not minor design tweaks.
- Stopping tests too early: Early results can be misleading; tests need to run their full course.
- Guessing instead of using data: Data-driven hypotheses are key to meaningful changes.
- Running tests at different times: Traffic patterns and external factors can skew results.
- Mismatching ad and landing page messages: Inconsistent messaging confuses users and hurts trust.
- Ignoring page load speed: Slow loading times can lead to higher bounce rates and flawed data.
- Not segmenting your users: Aggregated data hides important insights from different audience groups.
- Ignoring statistical significance: Acting on results without proper validation risks poor decisions.
10 Common A/B Testing Mistakes in eCommerce and How to Avoid Them
A/B Testing Course 029: Typical Mistakes While Running an A/B test.
1. Testing Multiple Variables at Once
Trying to change too many things at once can leave you scratching your head about what actually made the difference. For example, if you see a 15% boost in conversions, was it because of the new headline, the updated button, or the different image? Without knowing, your data becomes far less useful.
This kind of uncertainty can make it harder to act on your results. Worse still, a positive change in one area might be cancelled out by a negative change in another, leaving you with a result that looks flat and unhelpful. This confusion can lead to poor decisions that directly hurt your eCommerce performance.
Research backs this up. A meta-analysis of 2,732 A/B tests showed that focusing on a single variable delivers much clearer and more reliable insights than testing multiple variables at the same time. The more variations you test, the higher the risk of false positives. Take Google’s 2009 experiment with 41 different shades of blue for search result links. At a 95% confidence level, testing so many variations created an 88% chance of producing a false positive.
"The key here is to test only one variable at a time... This approach allows you to pinpoint the exact element driving performance changes." - Josh Gallant, Founder, Backstage SEO
To get clean, actionable results, focus on isolating each element. Test them one by one - start with your product title, move on to your CTA placement, and then look at your button contrast. While running these tests, avoid making any other changes to your site. This means no tweaks to your style, no adding trust badges, and no header updates. Keeping everything else constant ensures your results stay accurate.
Next, let’s dive into how sample size plays a role in shaping your test outcomes.
2. Using Too Small a Sample Size
Running tests with too little data is like flipping a coin twice and expecting to predict the future. When you lack enough visitors, you're essentially basing decisions on random fluctuations instead of meaningful patterns. This can lead to two major problems: you might declare a "winner" that doesn’t actually perform better (a false positive), or you could miss genuine opportunities for improvement (a false negative).
For example, the number of visitors needed depends heavily on your baseline conversion rate and the improvement you're trying to detect. If your eCommerce site has a 2.5% baseline conversion rate and you're aiming to spot a 20% improvement, you’ll need around 15,288 samples per variation - which means over 30,000 visitors in total. If your baseline conversion rate is lower, say 1%, the required sample size jumps to approximately 24,000 samples per variation. The lower the conversion rate, the more traffic you’ll need to ensure your results are reliable.
Checking your test results daily can also lead to misleading conclusions. Early promising results often fade over time due to regression to the mean, which can inflate your false positive rate. This highlights why having a sufficient sample size is critical for trustworthy outcomes.
To avoid these pitfalls, calculate the required sample size before starting your test and ensure it runs for at least two weeks to account for weekly traffic variations. Set realistic expectations by choosing a Minimum Detectable Effect (MDE) of 5–15%, rather than hoping for dramatic 50% improvements. Stick to the industry standard of 95% confidence and 80% statistical power, and aim for at least 100 conversions per variation before making any decisions. Patience and proper planning are your best tools for reliable testing.
3. Testing Elements That Don't Matter
Once you've ensured your sample sizes are sufficient, it's time to focus on testing elements that genuinely impact purchasing decisions. Not every tweak is worth the effort. For instance, testing button colours, font styles, or social share buttons rarely moves the needle when it comes to actual purchases. Studies show that changing button colours typically results in less than a 1% difference in conversions, often falling short of statistical significance.
"Focus on what affects decision-making - not design gimmicks. Messaging, clarity, and trust triggers usually perform better than aesthetic changes." - Bogdan Rancea, Founder and Lead Curator at ecomm.design.
The same principle applies to low-traffic pages like "About Us", "Contact Us", or "Terms and Conditions." These pages are unlikely to deliver meaningful results. For example, testing the colour scheme of a size chart won't have the same impact as rethinking product titles or repositioning the "Add to Cart" button. Spending time on minor elements without considering their effect on revenue is like optimising in a vacuum.
Every hour spent on insignificant tweaks is an hour not spent on changes that could make a real difference - like improving the checkout process or boosting trust signals. Here's a compelling example: a brand with 150,000 monthly visitors and an average order value of $120 could generate an additional $540,000 in annual revenue with just a 0.5% increase in its conversion rate. Testing impactful elements such as product title formats (which can increase add-to-cart rates by 5.3%) or scarcity badges (which can drive conversions up by 11.5%) is far more effective than fiddling with footer links.
To pinpoint where your efforts will pay off, use tools like heatmaps, session recordings, and analytics to uncover friction points. Prioritise testing elements that influence decision-making - think messaging, urgency cues, pricing displays, and trust signals. Focus on high-traffic pages, such as product pages and checkout flows, where changes are most likely to boost revenue.
Next, we'll dive into the common pitfalls of testing durations.
4. Stopping Tests Too Early
Jumping to conclusions the moment a test hits '95% significance' can seriously undermine its reliability. Why? Because those early "winning" results might just be random noise rather than actual performance differences.
Here’s the thing: 95% significance means that if you repeated the test 20 times, you’d expect the same result 19 times. But this only holds true if you let the test run its full course, reaching the sample size you set beforehand. In eCommerce, tests often need to run for 2 to 4 weeks to capture a complete picture of consumer behaviour over an entire buying cycle. This timeframe accounts for fluctuations like weekday vs. weekend traffic and ensures late-converting visitors are included. Without this, you risk basing decisions on incomplete - and misleading - data.
The consequences of cutting corners can be severe. In some cases, relying on incomplete data has led to revenue drops as steep as 42% annually. To minimise this risk, experts suggest waiting until each variation collects at least 100 to 500 conversions before making any calls. For instance, if most customers take about three days to make a purchase after their first visit, your test needs to run long enough to capture those delayed conversions. Stick to a disciplined approach to avoid costly mistakes.
To ensure your results are solid, follow these guidelines: stick to your pre-set sample size, run tests in full seven-day increments, and avoid making mid-test changes, like adjusting traffic allocation or turning off variations. Also, steer clear of running tests during major sales events or holidays, as these periods can introduce unpredictable variables that skew your data.
Patience truly pays off. A steady 1% monthly improvement in conversions can snowball into about 12.7% growth over a year - but only if your decisions are backed by reliable, statistically sound data.
5. Testing Based on Guesses Instead of Data
Once you've ensured your test durations and sample sizes are adequate, the next step is to avoid relying on gut feelings to guide your decisions.
Running A/B tests based on intuition often leads to wasted resources and missed opportunities. As DIGITXL aptly puts it:
"Making website changes without data is like throwing darts blindfolded - some might land, but most will miss."
The consequences? Higher bounce rates, lower engagement, and lost revenue. Without a data-driven hypothesis, you risk focusing on elements with minimal impact - like tweaking button colours on low-traffic pages - while potentially harming the user experience and conversion rates.
Take a page from Bannersnack's playbook. Using session replays, they discovered that long-term users were ignoring the "timeline view" feature. Instead of guessing the cause, they identified the issue: the button was too small. After testing a larger button, they saw a 12% increase in feature adoption. Similarly, Yatter's Managing Director, Gavin, tackled high checkout drop-offs for a stem cell therapy client. Session replays revealed users spent too much time on product information, hinting at trust concerns. By adding case studies and an explanatory video, conversions improved by 10%.
Every test should begin with a clear "if-then" hypothesis: "If [change is made], then [specific result is expected]." Start by auditing your analytics to identify where customers drop off - whether it's cart abandonment, mobile usability issues, or high bounce rates on critical pages. Tools like heatmaps and session replays can help uncover the why behind the numbers. Prioritise testing on high-impact pages within your sales funnel instead of spending time on less critical pages like "About Us."
6. Running Tests at Different Times
When testing hypotheses, it’s crucial to avoid running test variations at different times. Why? Because comparing results from different periods introduces inconsistencies. Traffic naturally fluctuates depending on the day of the week, time of day, or external events. As Paul Park from Unbounce aptly puts it:
"Comparing a high-traffic Wednesday to a low-traffic Tuesday is like comparing apples to oranges."
For example, if you test Version A one week and Version B the next, you're not actually measuring the effect of your changes. Instead, you're measuring the differences between two entirely separate time periods.
External factors like holiday seasons, paydays, weather changes, or breaking news can skew results by coinciding with natural traffic shifts. Similarly, a sudden change in traffic sources - such as an unexpected surge in paid search traffic - can disrupt your test. Visitors from different channels often behave differently, and their level of trust in your site may vary.
Here’s a real-world case from April 2021, shared by Microsoft's Ronny Kohavi. A website with one million daily visitors split its traffic differently over two days: Friday (1% to treatment) and Saturday (50% to treatment). On both days, the treatment outperformed the control (Friday: 2.30% vs 2.02%; Saturday: 1.20% vs 1.00%). However, when the data was combined, the treatment seemed to underperform (1.20% vs 1.68%) because Saturday’s lower-converting traffic carried more weight. This highlights how uneven traffic distribution can distort results.
To ensure reliable insights, always run control and challenger versions at the same time. Use A/B testing platforms that split traffic in real-time, and conduct tests over full seven-day cycles to capture both weekday and weekend behaviours. Avoid launching new campaigns or making site-wide changes during tests, and keep an eye out for anomalies like competitor sales or technical issues .
Finally, maintaining consistent messaging between your ads and landing pages is another way to stabilise your testing outcomes.
7. Mismatching Ad and Landing Page Messages
Keeping your ad and landing page messages consistent is crucial in eCommerce A/B testing. Imagine clicking on an ad promising "50% off all winter boots", only to land on a generic homepage with no mention of the sale. This kind of disconnect can confuse visitors and derail conversions.
Studies reveal that 70% of conversion improvements come from copy and messaging, while design accounts for just 10%. Yet, many eCommerce businesses focus heavily on aesthetics while neglecting the alignment between their ads and landing pages. Visitors typically form an impression within 5.25 seconds of arriving on a page. If your headline doesn’t immediately confirm the promise of the ad, you risk losing them. Consistency between the ad and landing page builds trust and encourages users to stay.
"Every ad is a promise. The landing page is where you keep it." - Commit Agency
So, how do you fix this? Start by mirroring your ad's primary message in your landing page headline. For instance, if your Facebook ad promotes "same-day delivery in Sydney", make sure that exact phrase is prominently displayed at the top of your landing page. Maintain visual harmony by using the same product images, colours, and fonts from the ad to avoid confusing users.
Also, ensure your call-to-action (CTA) aligns perfectly. Testing personalised CTAs against generic ones like "Shop Now" can lead to conversion gains of 10% to 21%. If your ad says "Claim Your Discount", don’t switch to something vague like "Browse Products" on the landing page. Consistency in language throughout the user journey is essential for better results.
8. Ignoring Page Load Speed
Page load speed is more than just a minor inconvenience - it can seriously mess with your A/B test results. When your site takes too long to load, visitors often leave before they even see the test variations. This creates a black hole in your data. For context, 40% of users will abandon a website if it takes more than 3 seconds to load. And just a one-second delay? That can lead to 7% fewer conversions and 11% fewer page views.
Things get even trickier when you add A/B testing tools into the equation. These tools can introduce what's called a "flicker effect." This happens when the original content briefly appears before the test variation loads. Believe it or not, visitors can pick up on flickers in as little as 0.13 milliseconds, which can undermine the user experience and skew your test data.
"If your site slows down, your conversion rate will probably go down, and your bounce rate will probably go up." - Contentsquare
Speed issues are especially problematic for mobile users. With mobile traffic making up over 60% of eCommerce visits, any delays on smartphones can disproportionately impact your results. A variation that seems to perform poorly might not actually be the problem - it could just be loading too slowly, causing users to exit before interacting with your changes.
To avoid this, run an A/A test before launching your A/B test. An A/A test compares the same version of your site against itself, with the testing software running in the background. This allows you to spot any performance issues caused by the tool itself and ensures you're working with clean data. Fixing speed problems early ensures that your test results reflect actual user behaviour, not technical hiccups.
Next, we’ll look at how failing to segment your audience can further throw off your A/B testing outcomes.
9. Not Segmenting Your Users
After addressing test design and timing, another common misstep is failing to segment your users. Treating all visitors as a single group can hide critical differences in how various segments respond. For instance, a variation might resonate strongly with mobile users but fail to engage desktop users. If you lump all your data together, this key insight gets buried.
Aggregated data can be misleading. Simpson's Paradox is a perfect example - it shows how trends in segmented data can completely reverse when combined. Imagine your test results showing an overall decline, even though the variation performed better within each segment. The conflicting behaviours cancel each other out, leaving you with a distorted view.
Behavioural tendencies like Change Aversion and the Novelty Effect add another layer of complexity. Returning visitors often prefer the control version because it feels familiar, while new visitors might gravitate toward the variation because it seems fresh. If you don’t segment your data, these opposing behaviours can mask the true performance of your test. Studies suggest it takes about 12 days for the influence of returning users to diminish, revealing a more accurate picture of how a variation performs.
"When you analyse test results only in aggregate, you might miss that a change works wonderfully for one segment but actually harms conversions for another." – Aureate Labs
To address this, focus on analysing results by key segments, such as:
- New versus returning visitors
- Device type (mobile versus desktop)
- Traffic source (paid versus organic)
- Lifecycle stage (first-time buyers versus loyal customers)
Start with broader categories to ensure enough data for meaningful analysis, then dig deeper into behaviours like cart abandonment or purchase frequency. Businesses that use segmented A/B testing report a 37% higher ROI compared to those that don’t.
Next, we’ll explore the final pitfall: ignoring statistical significance.
10. Ignoring Statistical Significance
One of the biggest pitfalls in decision-making is acting on results that lack statistical significance. When you skip this step, you're essentially rolling the dice, basing decisions on random fluctuations instead of actual user behaviour. Statistical significance is what tells you that your results are reliable and not just a stroke of luck. This ties back to earlier points about test duration and sample size - every aspect of your test needs to be validated statistically.
In eCommerce, the gold standard is a 95% confidence level. This means there’s only a 5% chance that any observed improvement is due to randomness. Yet, only about 20% of A/B tests actually meet this benchmark. Despite this, many brands jump the gun, implementing changes based on early "wins" that later prove to be unreliable. This is where the lack of proper statistical safeguards can lead to costly mistakes.
"When we do hypothesis testing, we're always asking, does the evidence we collected make our null hypothesis look ridiculous? Yes or no? What the p-value does is provide an answer to that question." – Cassie Kozyrkov, Chief Decision Scientist, Google
A common trap is the "early peeking" fallacy. This happens when a test is stopped as soon as it hits 95% significance, ignoring the fact that significance levels can fluctuate throughout the testing period. To avoid this, you need to calculate your required sample size in advance - usually at least 100 conversions per variation - and run your test for a minimum of two full business cycles (typically 2–4 weeks). This ensures you capture weekly buying patterns and get reliable results.
Set your confidence threshold before starting and use A/B testing tools to calculate p-values and statistical power accurately. Avoid making mid-test changes to traffic distribution or design elements, as these adjustments can compromise the reliability of your results. If you skip these steps, you risk acting on noise rather than meaningful data, potentially wasting resources on "winning" variations that could hurt your long-term revenue. Getting a firm grip on these statistical principles is essential for refining your testing strategy.
Conclusion
A/B testing isn’t about quick wins or gut feelings. It’s about creating a systematic, data-driven approach that leads to steady, compounding growth. Think about it: even a modest 1% improvement each month adds up to 12.7% annual growth, and a 2% monthly boost compounds to 26.8% growth. These small, carefully tested changes build momentum over time - far more reliable than taking random shots in the dark.
Looking back at the common pitfalls mentioned earlier, the truth is that most eCommerce brands don’t need more traffic - they need to convert the visitors they already have. By steering clear of mistakes like testing too many variables at once, ending tests prematurely, or ignoring statistical significance, you can avoid wasting your marketing budget on changes that don’t deliver results. Instead, you’ll uncover real issues, like a 68% cart abandonment rate or a 50% homepage bounce rate, and address them effectively.
Key elements like hypothesis-driven testing, sufficient sample sizes, running tests through full business cycles, audience segmentation, and maintaining statistical accuracy are non-negotiable. Without these, your decisions rest on shaky foundations. In fact, acting on false-positive data could cost up to 42% of your annual revenue.
If you’re ready to ditch the guesswork and embrace a framework that drives consistent growth, Uncommon Insights can help. They work with FMCG and eCommerce businesses to create tailored strategies that transform data into actionable plans - whether it’s growth audits, retention strategies, or incrementality testing. Don’t stay in the dark - start making decisions that lead to lasting success.
FAQs
Should I use A/B testing or multivariate testing?
When deciding between testing methods, consider your goals and resources. A/B testing is perfect for evaluating a single variable, such as button colours or headlines. It’s straightforward and offers clear insights, making it ideal for simpler experiments.
On the other hand, multivariate testing examines how multiple changes work together. While it provides deeper insights into the interaction of different elements, it demands more traffic and a larger sample size to yield reliable results.
In short, choose A/B testing for focused, straightforward goals, and opt for multivariate testing when you have ample data and want to refine multiple elements at once.
How do I calculate the right sample size for my A/B test?
To figure out the correct sample size for an A/B test, you’ll need to factor in statistical significance, the expected effect size, and the desired power of your test. Here’s how to approach it:
- Start by defining your baseline conversion rate (the current performance you’re measuring against).
- Determine the minimum detectable effect, which is the smallest improvement you want to confidently identify.
- Select a significance level (commonly 95%) and a power level (often 80%).
Once you have these numbers, plug them into a sample size calculator to ensure your test results are accurate and trustworthy.
What user segments should I analyse in eCommerce tests?
To connect with Gen-Z and Millennials, it's crucial to focus on the platforms they frequent most - think Instagram, TikTok, and Facebook. These are not just social media hubs; they’re also key shopping destinations for these age groups.
Tailor your eCommerce tests to align with the features and shopping behaviours unique to each platform. For instance, Instagram and TikTok thrive on visually engaging content, while Facebook may appeal more to community-driven interactions and targeted ads. By understanding how each platform resonates with these audiences, you can fine-tune your strategies and see better results.
Related Blog Posts
10 A/B Testing Ideas for eCommerce Ads
Shopify conversion rate optimization checklist
FMCG vs. eCommerce: A/B Testing Differences
How to Map DTC Customer Touchpoints
What mythbusters can teach you about running an eCommerce store
Case Study: Improving Checkout Speed for eCommerce
Newsletter
The Uncommon Insights Letter
Practical FMCG & eCommerce growth playbooks — margins, retention and scaling tactics, straight to your inbox.
Turn these ideas into profit you can see
Get a hands-on operator to turn the frameworks above into results — book a free audit call.